Heat capacity and fate of Earth’s energy imbalance
|
Heat capacity and fate of Earth’s energy imbalance |
The average temperatures of the stony inner planets in our solar system are determined by the balance between incoming solar radiation energy and outgoing radiation energy from the warmed planetary surface. (See Light energy: absorption, emission, and planetary temperature, Parts D and E, for a deeper look.) During their lifetimes (billions of years), the planets and the Sun itself have undergone many changes that altered the energy balance and, hence, the planetary temperature. The geologic record for the Earth shows that these natural changes took thousands to millions of years. Now, human activities have disrupted Earth’s energy balance in only about 250 years and continue to do so with too little sign of stopping. Extra energy is being added to our planet, and here we’ll explore what happens to it. |
||||||
A. Sunshine, air, and water |
||||||
|
||||||
| Procedure and analysis | ||||||
Fill one of the bottles with water (leaving room for the stopper) and insert the stopper with thermometer in each bottle. Read and record the temperature in each bottle and then place them side by side in the bright sun or, if necessary, under a bright light or heat lamp. Let the bottles sit in the light for about 15 minutes and then, again, read and record the temperature in each bottle. Empty the bottle of water and return the materials. |
||||||
1.
|
When you handled and lifted the air- and water-filled bottles to place them in the light, what difference(s) did you notice between them? Would this be expected? Explain why or why not. |
|||||
2.
|
Do you expect the amount of energy from the sunlight (or its proxy) absorbed by the surface of each bottle to be the same or different? If different, what would be the difference? Explain your answers to these questions. |
|||||
3.
|
What were the initial and final temperatures in the air-filled bottle? In the water-filled bottle? Was there anything unexpected about these results? Explain the reasoning for your response. |
|||||
4.
|
Is your observation from item 1 and expectation from item 2 consistent with the experimental results in item 3? Clearly explain the reasoning (including any evidence you might have from experience) for your response. |
|||||
B. "Greenhouse" effect energy imbalance |
||||||
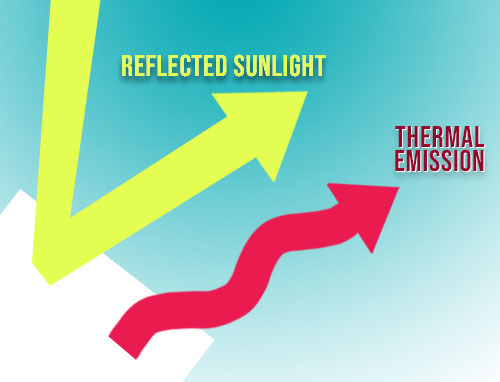
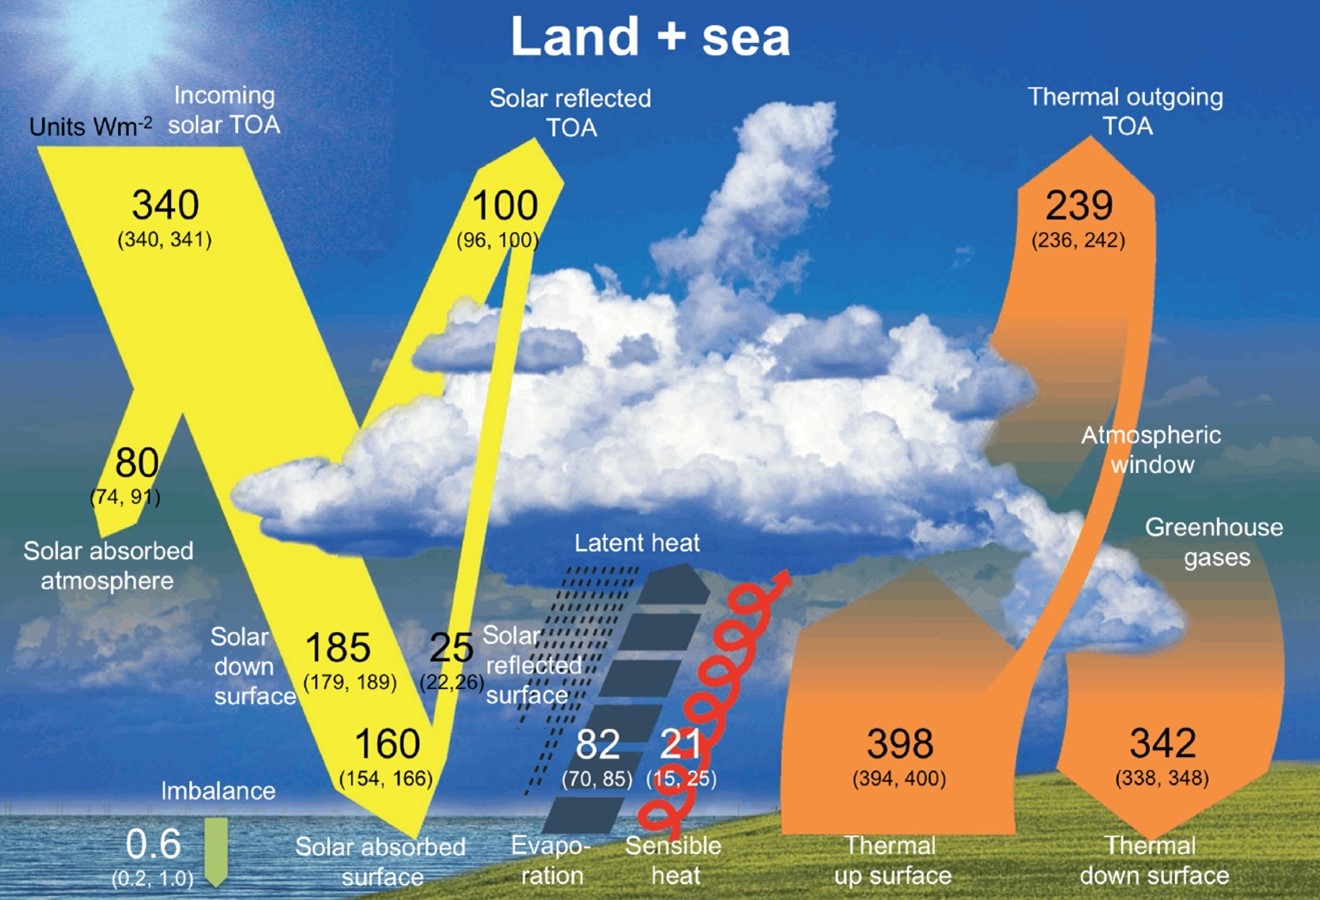
| The way the atmospheric (planetary) warming “greenhouse” effect works, due to the presence of infrared-absorbing gases in the atmosphere, is outlined in the Workbook's Global warming and greenhouse effect background introduction. The effect has kept the Earth’s average temperature suitable, with lots of variations, for life as we know it (from single-celled to complex organisms) for billions of years. Figure 1 shows that Earth’s energy flows, including the “greenhouse” effect, are complex and are imbalanced due to the present composition of the atmosphere with its extra, human-caused greenhouse gases. The units for the numerical values in the figure are energy flows, that is, energy as a function of time moving onto, through, or from a surface, in watts per square meter, W/m2 (1 W = 1 J/s). | ||||||
|
||||||
As you see, not all the sunlight (mainly visible radiation) that reaches the top of the atmosphere (TOA) actually reaches the Earth’s surface. Some of it is simply reflected away by clouds or from the surface, especially by ice and snow. This reflection is called the Earth’s albedo, its “whiteness” (from the Latin word for whiteness). Climate change affects the albedo by melting ice and snow, so less light is reflected and more absorbed to further warm the surface. (See Light energy: absorption, emission, and planetary temperature) Other parts of the sunlight are absorbed by the atmosphere. Very importantly, the shortest wavelength ultraviolet radiation is absorbed by oxygen and ozone in the stratosphere, which prevents most of these damaging (to living organisms, including us) wavelengths from reaching the surface. (See the Workbook's Global warming and greenhouse effect background introduction for a bit more information about the wavelengths that do and don’t reach the surface.) Some of the energy emitted as infrared radiation from the warm Earth surface passes directly through the “atmospheric window” into space. The “window” is simply a range of infrared wavelengths that are not absorbed by any atmospheric gas, so those emitted wavelengths pass through the atmosphere. All the other emitted infrared wavelengths are absorbed by one or more of the greenhouse gases. Subsequently, these gases re-emit these wavelengths in all directions, including back toward the surface of the Earth as well as outward toward space. The atmospheric emission from the greenhouse gases that comes back to the surface makes the surface warmer than it otherwise would be. This “greenhouse” effect has kept the planet warm enough for the evolution of its enormous diversity of life, but this life is now threatened by the human-caused increase in the warming. In addition to the energy flows carried by electromagnetic radiation (light), there are two energy transfers from the surface to the atmosphere shown by the arrows in the middle of Figure 1. The one on the left (“evaporation”) is the energy being transported in water vapor evaporated from liquid water at the surface. (See Energy transfer, phase change, and temperature) The energy taken up by the evaporating water (latent heat) is then transferred to the atmospheric gases when the water vapor condenses to liquid droplets. The arrow on the right (“sensible heat”) is energy entering the atmosphere when air molecules are warmed by contact with the surface and then buoyed higher up in the atmosphere. This transfers energy from the warmed surface to the atmosphere by conduction and convection of the air molecules. Both these transfers depend on the movement of molecules from or near the surface higher into the atmosphere. The figure indicates that they transfer about 103 watts from each square meter of surface into the atmosphere. |
||||||
5.
|
Focus on light entering or leaving the planet at the top of atmosphere (TOA). Energy entering is positive and energy leaving is negative. What is the algebraic sum of the TOA energies? Is the net flow of energy toward or away from the planet? Explain your response. |
|||||
6.
|
Consider the energy flows (including “evaporation” and “sensible heat”) entering or leaving the surface of the planet. Energy entering is positive and energy leaving is negative. What is the algebraic sum of the energy flow at the surface? Is the net flow of energy toward or away from the planet? Is this result consistent with the result of item 5? Explain your responses. |
|||||
7.
|
Consider energy flows in the atmosphere itself. We see that 398 W/m2 of infrared energy enters the atmosphere from the surface and 239 W/m2 are lost to space at the TOA, which leaves 159 W/m2 to be accounted for. We have said that emissions from the greenhouse gases is both out toward space and down toward the surface, so the 159 W/m2 can be accounted for as coming to the surface. But the amount of infrared energy coming from the atmosphere to the surface is shown as 342 W/m2. Where does the atmosphere get the other 183 W/m2 that ultimately gets to the surface as infrared energy emitted by greenhouse gases? Clearly explain your response with reference to Figure 1. |
|||||
8.
|
At the far bottom left of the figure is energy, 0.6 W/m2, labeled “imbalance”, entering (remaining on) the Earth. This imbalance is the “forcing” that is causing the planet to warm because of the extra greenhouse gases produced by human activity. The values in the figure are rounded and have some uncertainty. Within a reasonable uncertainty, is the imbalance (net added energy) consistent with the results of items 5 and 6? Explain your response. |
|||||
| This forcing, 0.6 W/m2, seems like a tiny amount of extra energy, hardly enough to power a small LED in the middle of the square meter. But there are a lot of square meters on the surface of the Earth. | ||||||
9.
|
The radius of the Earth is about 6.4 x 10⁶ m. Assuming a spherical planet, find its surface area. |
|||||
10.
|
One watt is one joule per second. Find the total amount of extra energy, in joules, gained by the Earth in one year (365 days) for an imbalance of 0.6 W/m2. |
|||||
This extra energy ends up in everything at the surface—plants, soil, rocks, ice, air, and water. Of particular interest are the ocean (full of life and covering 70% of the planet) and the air (where we live). |
||||||
C. Warming energy in the oceans |
||||||
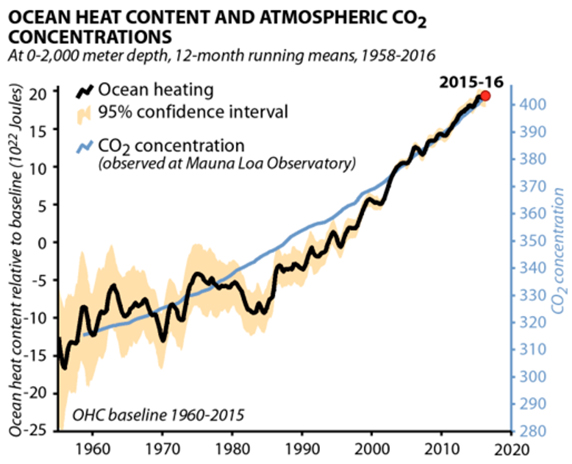
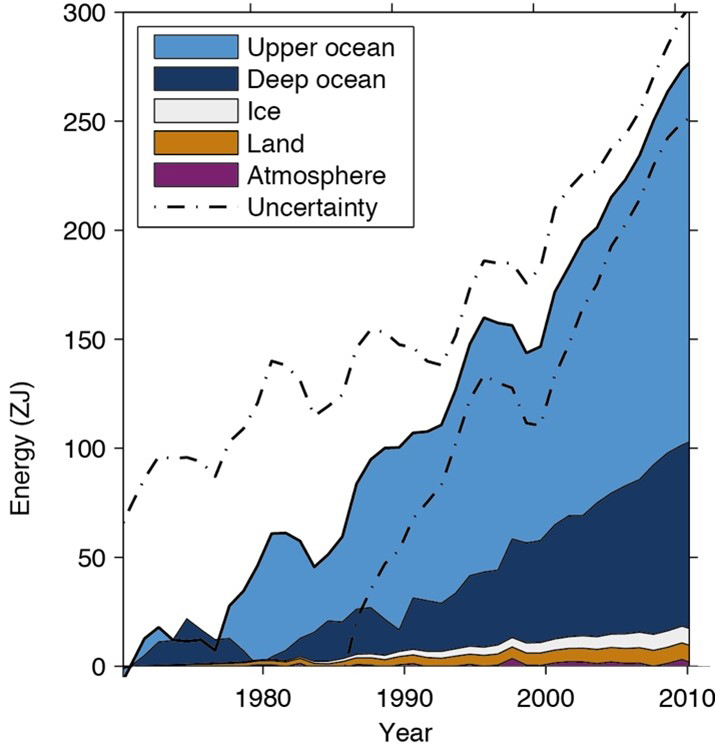
Data for the increasing ocean heat (energy) content are shown in Figure 2. These are cumulative data that represent the total energy content at each time point for the top 2000 meters of the ocean. The energy scale is in units of 1022 joules. |
||||||
|
||||||
The amount of energy added from one year to the next, ΔE, is given by the relationship, ΔE = mCPΔT, where m is the mass of the seawater, CP is its specific heat capacity (per unit mass), and ΔT is its change in temperature. Complications arise from the vastness of the ocean and variability from one place (including depth) to another. Thus, the calculation involves considering the whole ocean as a lot of smaller volumes, finding the energy change in each one (based on its properties), and summing these to get a total ΔE. There are obviously many ways to make the choices involved in this procedure, which accounts for the modest differences in results you will find in different sources. No matter which you consult, however, the conclusion is the same: the ocean is gaining energy. To get the values of ΔT used for the calculations, a baseline has to be chosen, from which to measure the changes. For the analysis in Figure 2, the average value for the period 1960-2015 was chosen. Annual ΔT values will be a bit below and bit above the average in this period, so ΔE values will be a bit below and bit above zero, as is seen on the plots. Since earlier years have lower energy, their values on the scale are negative, but this is irrelevant—only differences from one time to another are of interest. Note that more recent data, since about 2000, are the most consistent and have the lowest uncertainty (confidence level very high) of any in the 58-year time shown. (Why are these data so much better than the previous 42 years?) |
||||||
11.
|
Find the slope of the global ocean plot, joules/year, for the decade 2005-6 to 2015-16. |
|||||
12.
|
How does the annual increase in ocean energy compare to the annual amount of the solar energy imbalance from item 10? Does the Figure 3 graphic capture the comparison reasonably well or not? Explain your reasoning. |
|||||
|
||||||
D. Warming energy in the atmosphere |
||||||
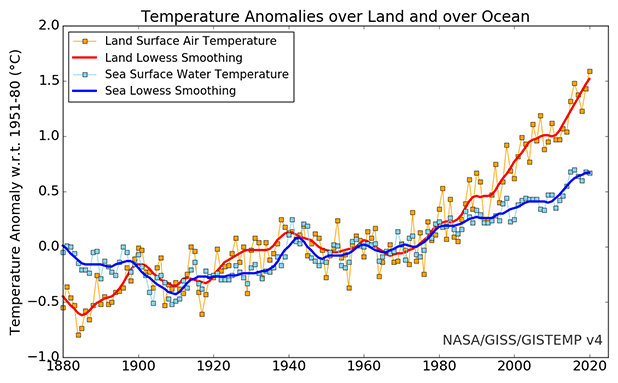
Although it’s difficult to tell from Figure 3, the Earth’s atmosphere is also gaining energy and warming. This is more clearly shown in Figure 4, where the increasing average change in air temperature over land is compared to the changing sea surface water temperature. Over about the past 40 or so years, the increase to the atmosphere has been about 1.4 K. Assuming that the entire atmosphere has been warmed, we can see how much energy was gained to give this ΔT, using the mass of the atmosphere and the heat capacity (specific heat capacity) of its gases. |
||||||
|
||||||
“Weighing” the atmosphere is relatively easy. Whenever you read a barometer, you are weighing the atmosphere. The force pressing down on the surface and supporting the column of barometric fluid (usually mercury) is a result of the gravitational attraction by the Earth on the mass of the atmosphere directly above it. For mercury, the height of the barometric column at sea level is 76 cm (= 0.76 m). |
||||||
13.
|
Imagine a barometer with a tube that has a cross-sectional area of one square meter, 1 m2. The mass of mercury (density = 13.5 x 10³ kg/m3) in this barometric column at sea level is equal to the mass (in kg) of air pressing down on each square meter of Earth’ surface. |
|||||
14.
|
In item 9, you calculated the surface area of the Earth. Calculate the total mass of the atmosphere. |
|||||
15.
|
The diatomic gases nitrogen, N2, and oxygen, O2, make up about 99% of the atmosphere. The specific heat capacity of these gases is about |
|||||
16.
|
How does the annual increase in atmospheric energy compare to the annual increase in the ocean energy? What relationship, if any, is there between this comparison and the results of Part A, where the temperature change was compared between containers of air and water placed in the same sunny location? |
|||||
17.
|
The Sun is the source of almost all of the energy humans use on Earth. Make a list of all the energy sources you can think of that humans use that are related to the sun. Make another list of energy sources that are not related to the sun. |
|||||
E. Passive radiative cooling |
||||||
The energy flows illustrated in Figure 1 and their consequences for a warming Earth are essentially all about averages over the entire planet. But none of us lives “on the average”. Some of us live in warm places and others in cool locales and we all experience the difference between daylight when the Sun is above the horizon and the darkness of night when the Sun is not in the sky. And we almost always observe that the nighttime temperature is lower than the daytime temperature. In fact, surfaces can become cool enough to condense water from the air (dew) or even frost in colder areas. |
||||||
18.
|
Why is it usually cooler at night than during the day? Base your explanation on the concepts (not necessarily the numbers) illustrated in Figure 1. |
|||||
For centuries people, especially in drier areas of the Earth, have exploited this nighttime cooling effect to condense water from the air. This can be as simple as a sloping surface outdoors facing the sky from which the water runs off and is collected for household use. There is no external source of energy required to bring about the cooling and condensation; the process is passive. But it is also limited to only a fraction of a day, the nighttime. What if a passive device could be made that would keep a surface below ambient temperature both day and night? If this were possible, it would, for example, substantially increase the amount of water the passive condensation process could produce. |
||||||
19.
|
What would such a device have to be able to do to achieve passive cooling during the day when the Sun is shining? This is not a question of how such a device would be constructed, but rather what concepts it has to embody in order to meet its goal. Your response to item 18 might provide a clue or clues to help guide your explanation. |
|||||
 |
||||||
Instructor/presenter notes |
||||||
Note that there are links to other Workbook Activities embedded in the student-directed materials above. If you have reproduced those materials in paper (or even electronic) form to direct student activities, these references will be confusing. They are included as a reminder for you to replace the reference to the other Activity with some text explaining or reminding students of the relevant concept referred to. If you think this is unnecessary for your class, you should just delete the reference link. Following are calculations for and/or comments on the numbered items in the student material. |
||||||
Part A |
||||||
One way to prepare the black-painted bottles is to hold them on a one-hole stopper, with a dowel stuck in the hole as a handle, and spray paint them with flat black paint. Holding the bottle being sprayed inside a large open cardboard box lying on its side will contain the paint that is sure to miss the bottle. Wear disposable gloves when doing the spraying and do it in a well ventilated area or outdoors. Set the sprayed bottles on disposable paper/newsprint to dry. |
||||||
1.
|
Without giving away the expected response completely, the question was supposed to get students to be explicitly aware that the bottle of water weighs more than the bottle of air. This should be expected on the basis of experience picking up “empty” (air filled) containers and ones filled with materials like water or other visible stuff. |
|||||
2.
|
Since the exterior surfaces of the bottles are identical, the expectation is that absorption of radiant energy would be the same for both. Any difference in the results of the temperature measurements should reflect a difference in their contents, not the amount of energy absorbed. |
|||||
3.
|
The expectation is that the temperature in the air-filled |
|||||
4.
|
The heavier bottle of water contains more stuff (molecules), so it takes more energy to change its temperature than for the bottle of air with less stuff. Since the same amount of energy is available from the sunlight absorbed by each bottle, it will heat the bottle with less stuff to a higher temperature. The more energy it takes to change an object’s temperature, the higher its heat capacity (capacity for taking up energy). |
|||||
Part B |
||||||
5.
|
At the top of the atmosphere (TOA), energy in is incoming solar and energy out is reflected solar plus thermal outgoing |
|||||
6.
|
At the surface, energy in is solar absorbed and thermal down and energy out is evaporation, sensible heat, and thermal out |
|||||
7.
|
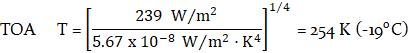
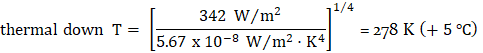
It’s pretty easy to see numerically where 183 W/m2 have come from in the atmosphere. There are three sources: solar absorbed (80 W/m2), latent heat of evaporation (82 W/m2), and sensible heat (21 W/m2). This is pretty much what students should be able to figure out. The more difficult question is how all this energy comes to the surface as infrared radiation from the greenhouse gases. Without going into detail, what we need to know is that the intensity of emission from any given parcel of gas in the atmosphere is proportional to the temperature of the gas, just as though it was following Planck’s black body emission equation. The intensity of the emission also depends on the concentration of the molecules doing the emitting. Most of the infrared energy flows shown in Figure 1 come from molecules in the troposphere (atmospheric layer closest to the surface that contains more than 90% of the atmosphere). The temperature and density (molecules per volume) of the troposphere decrease with altitude (distance from the surface). There are fewer and colder molecules at higher altitudes, so the emission intensity (amount of energy) is lower than for the more numerous molecules at warmer, lower altitudes. Much of the infrared energy that leaves the TOA comes from higher in the troposphere and most of what comes to the surface originates at lower altitudes. This difference explains the relative amounts of thermal energy leaving the TOA and thermal energy coming down to the surface. Part of the processes that maintain the temperature profile of the troposphere are the energies deposited in the atmosphere by absorbed solar radiation, latent heat of evaporation, and sensible heat. Their route to the surface, via infrared emissions from greenhouse gases, is indirect, but essential for maintaining Earth’s temperature. The Stefan-Boltzmann radiation law for emission from a surface, These temperatures make sense. High in the atmosphere, temperatures are well below the freezing point of water, 273 K, and closer to the surface above the freezing point. |
|||||
8.
|
The results in items 5 and 6 indicate that the energy imbalance for the Earth is a net gain of about 1 W/m2. Within the uncertainty shown, ± 0.4 W/m2 for the “imbalance” given in Figure 1, the net energy gain from the gains and losses is what makes up the forcing that increases Earth’s temperature. |
|||||
9.
|
AE = surface area of Earth = 4π(6.4 x 10⁶ m)2 = 5.1 x 10¹⁴ m2 |
|||||
10.
|
The total added extra energy per year is the imbalance per square meter per year times the number of square meters. The imbalance is given in W/m2 = J/s·m2, so we have to multiply this by the number of seconds per year to find the annual imbalance: annual energy imbalance per square meter total energy per year |
|||||
Part C |
||||||
11.
|
Reading the plot as 10 x 1022 J in 2005-6 and 19 x 1022 J in 2015-16 gives |
|||||
12.
|
The annual energy increase of the oceans (item 11) is almost equal to the total amount of extra energy added annually to the Earth from the “greenhouse” effect (item 10). This suggests that almost all the added energy goes into warming the oceans, as is illustrated in Figure 3, which captures this result visually. |
|||||
The more recent data in Figure 2 are mainly derived from an array of about 3500-4000 Argo floats distributed throughout the ocean basins. These floats sink to a depth of 2000 meters and then periodically rise slowly to the surface taking readings of temperature and salinity (saltiness) as a function of depth. When they reach the surface, they send their GPS coordinates and the recorded data to a satellite for transmission to the laboratories where the information is stored and analyzed. Then the floats sink again to repeat the process. The floats last about three years and about 1000 or more are added each year to maintain the coverage of the oceans. Before Argo, the data for the oceans were much more sparse and not well spread out, which is reflected in the much larger variations in the pre-2005 data in the figure. Scientists have also been experimenting with deep Argo floats with the ability to sink down to at least 6000 meters. The key to obtaining these depths is a change in the design from an aluminum cylinder to a glass sphere. A sphere can withstand much greater pressure than a cylinder. These floats will permit study of changes in heat content in the deep ocean, an area that has been only sparsely explored with current technology. |
||||||
Part D |
||||||
13.
|
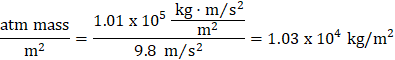
For the atmospheric calculations, the mass of a “box” of mercury that has a 1 m2 base and is 0.76 m high is equivalent to the mass of the atmosphere pressing down on 1 m2 of the surface: atmospheric mass per m2 surface An alternative approach, if students are familiar and comfortable with metric units, is to use atmospheric pressure in pascals (Pa) and newtons (1 N = 1 kg•m/s2), a unit of force = mass times acceleration. The pascal is force per square meter 1 Pa = 1 N/m2 = 1 (kg•m/s2)/m2 The force of the atmosphere pressing down on each square meter of Earth’s surface is the atmospheric mass per square meter times the acceleration due to gravity, 9.8 m/s2. Putting this all together with atmospheric pressure in pascal (1 atm = 1.01 x 10⁵ Pa) gives: 1 atm = 1.01 x 10⁵ Pa = 1.01 x 10⁵ N/m2 Rearranging the final equality to find atmospheric mass per square meter, gives: |
|||||
14.
|
Total atmospheric mass = (atm mass/m2) (surface area) This mass is a bit more than 5 million gigatonnes, where a gigatonne is a billion tonnes and a tonne is 1000 kg. These are the sort of mass units often used in discussing climate, climate change, and emissions of gases to the atmosphere. |
|||||
15.
|
The total amount of energy added in 40 years, ΔE, is given by the relationship, ΔE = mCP ΔT, where m is the mass of the atmosphere, CP is its specific heat capacity, and ΔT is its change in temperature during the 40 years. Total energy added to atmosphere over 40 years The average energy added to atmosphere per year |
|||||
16.
|
These simple calculations suggest that about 50 times more global warming is building up in the oceans than in the atmosphere, which is evident in Figure 3. The results in Part A show that, when water and air take up the same amount of energy (from the walls of the warmed bottles), water warms much less than air. That is, water has a higher specific heat capacity and takes up energy with only a small change in temperature. As conduction and convection exchange energy (the sensible heat in Figure 1) among land, sea, and air over the globe, energy tends to end up in the sea, because it’s cooler on average, and transfers are from warmer to cooler. |
|||||
|
||||||
Figure 5 shows that, as global temperature increased relatively rapidly after about 1980, land temperature rose about twice as fast as sea surface temperature. At least part of this difference is likely a result of the air-water-land water cycle. In this cycle, water evaporates from the oceans, rises in the air, condenses to form liquid (and solid), precipitates on land, and flows back into the oceans via rivers to complete the cycle. Of course, there is also precipitation over the oceans as well as the land, but there is more over land, as evidenced by the fact that there is enough to keep rivers flowing to the sea. Evaporation requires energy that is supplied by the water left behind, leaving the sea surface cooler. Condensation of the gaseous water, mainly over land, warms the air as the energy gained from evaporation is released. This energy reaches the land surface in the form of infrared radiation, as outlined in item 7 above. Transfer of energy (“latent heat”) from sea to land by the water cycle can maintain the temperature difference exemplified in Figure 5. Overall, this transfer of energy from sea to land is a minor effect compared to the amount of incoming solar energy that goes directly into the seas, which cover 70% of the planet and are excellent absorbers of both visible and infrared light. We are fortunate, in some respects, on Earth that almost all the extra energy from our energy imbalance goes into the oceans with their very high mass and heat capacity, instead of into the atmosphere and land. The downside is that a warming ocean is an expanding ocean and sea level is rising, as shown in Figure 6. The figure also shows that melting ice is adding further to sea level rise. (This figure is discussed further in Temperature, water volume, and sea level.) |
||||||
|
||||||
17.
|
Earthly energy sources dependent on the sun include: fossil fuels (energy from 100s of millions of years ago); hydroelectric (water cycle driven by evaporation), solar heating (water, molten salt, passive solar buildings), photovoltaic solar cells, wind turbines (differential solar heating creates the density differences that produce wind), biofuels (controversial), tidal turbines (the Sun’s gravity combined with the Moon’s drive the tides), hydrogen production by photochemical water splitting (not yet a commercial reality)…? Earthly energy sources not dependent on the sun: nuclear fission, geothermal (also nuclear—although not fission—since most of the Earth’s internal heat is from radioactive decay. See Earth’s internal energy and atmospheric argon) |
|||||
Part E |
||||||
18.
|
The most obvious difference between night and day (which we tried to signal in the introduction to this item) is the lack of sunlight at night. So, as we consider Figure 1, none of the energy flows shown in yellow on the left are present. There is no solar energy directly reaching the surface at our location during the night. But the surface is still warm and continues to emit infrared radiation as a black body, as represented by the orange arrows on the right of the figure. Therefore, where we are, there is no energy entering the top of the atmosphere, but there is still energy leaving. This imbalance means the planet is losing energy from our location and is getting cooler, so the night temperature drops somewhat. |
|||||
19.
|
A passive cooling device that will work both day and night must emulate the conditions discussed in item 18 during the day as well as night. That is, it must be freely able to radiate its black body infrared toward outer space while somehow not absorbing the solar radiation that will be falling on it. (We can’t just put a sunshade over it, because that would prevent the escape of the infrared radiation. The item does not ask how to get around the solar energy problem, but reflecting it away, so it is not absorbed to warm the cooling surface is a solution.) |
|||||
|
||||||
|
||||||
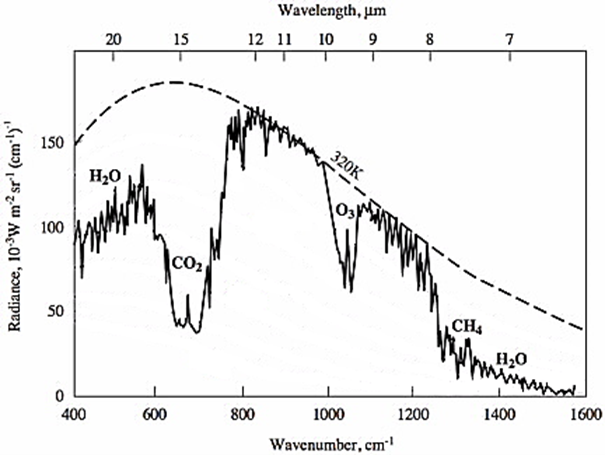
The figure shows that almost all the emission at wavelengths from 13 to 8 μm that leaves the surface (the dashed curve) is detected by the satellite (solid curve) well outside the top of the atmosphere. (Only a tiny amount of the energy emitted in this wavelength range is intercepted by interaction with the small amount of ozone pollution in the lower atmosphere.) Since the emitted infrared photons travel at the speed of light, the great majority of those in the 13 to 8 μm wavelength range pass from the surface to outer space in less than a millisecond. It’s as though there is a direct connection (one-way) between an emitter of these wavelengths and the deep cold of outer space. The tricky part is engineering an emitter that concentrates its emission in this range. Research groups from Stanford, Columbia, Purdue, and the University of Wisconsin-Madison have created four different ways to do this and produce passive daytime radiative cooling systems. |
||||||
(1) Raman, A. P., Anoma, M. A., Zhu, L., Rephaeli, E. & Fan, S., “Passive radiative cooling below ambient air temperature under direct sunlight”, Nature, 2014, 515, 540-544. This approach has been commercialized. (2) Mandal, J., Fu, Y., Overvig, A. C., Jia, M., Sun, K., Shi, N. N., Zhou, H., Xiao, X., Yu, N., & Yang, Y., “Hierarchically porous polymer coatings for highly efficient passive daytime radiative cooling”, Science, 2018, 362, 315-319. The story of this approach was told by XiaoZhi Kim, “Beat the heat with paint”, ChemMatters, April 2021, 5-8. (3) Li, X., Peoples, J., Yao, P., & Ruan, X., “Ultrawhite BaSO4 Paints and Films for Remarkable Daytime Subambient Radiative Cooling”, ACS Appl. Mater. Interfaces, 2021. (4) Zhou, M., Song, H., Xu, X., Shahsafi, A., Qu, Y., Xia, Z., Ma, Z., Kats, M. A., Zhu, J., Ooi, B. S., Gan, Q., & Yu, Z., “Vapor condensation with daytime radiative cooling”, Proceedings of the National Academy of Sciences, 2021, 118 (14) e2019292118. |
||||||
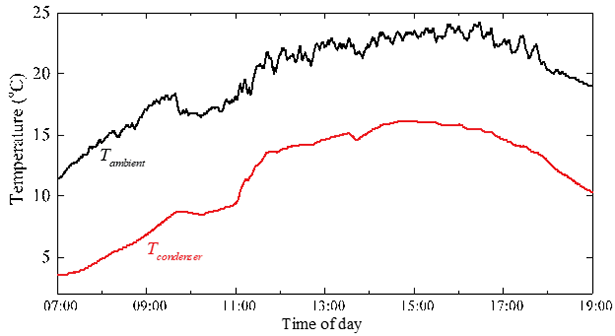
Among the data and figures in their articles, all four groups present experimental results from small-scale setups that demonstrate passive daytime radiative cooling below the temperature of the air surrounding the apparatus, as exemplified in Figure 8. Depending on conditions (weather, location, etc.), cooling of about 4 to 8 °C below ambient could be achieved. This doesn’t seem to be a very large effect, so how is it used and how is it connected to climate change? |
||||||
|
||||||
One objective of the first three research groups was to invent materials that produce passive daytime radiative cooling for use in reducing the amount of air conditioning needed by companies and businesses in their buildings. Air conditioning uses a large amount of electrical power, so reducing the amount required reduces the need for electric power and speeds the transition away from fossil fuel power plants. Air conditioners work by absorbing thermal energy in a fluid inside the building and pumping the fluid to coils outside the building where energy is released to the surrounding air. If more energy could be released to the surroundings, the pump wouldn’t have to run as much to remove the required amount of energy from the inside. Putting the coils in contact with a passive daylight radiatively cooled surface, like that based on the research reported by Raman et al. (or making the coils themselves the surface), would increase the amount of energy released to the surroundings (outer space, in fact). A technique already used for lowering the air conditioning load of buildings is to give them white roofs. These reflect a good deal of sunlight, so less energy is absorbed to raise the temperature inside. (White roofs have been used for thousands of years to keep buildings cooler than they would be with dark roofs. See Light energy, absorption, emission, and planetary temperature for a comparison of heating white and black surfaces by solar radiation.) The technique would be enhanced if the reflective surface incorporated passive daylight radiative cooling. This might be relatively easy to accomplish with the approaches developed and reported by Mandal et al. and Li et al. The first approach creates the emitting layer for the radiative cooling by coating a reflective surface with a liquid (like a coating of paint) that forms the radiative emitter when it dries. The second approach incorporates both the reflector, white crystals of BaSO4, and emitter, a selected size range of the crystals, in a thick paint. These paints would add emission of infrared energy to refection of solar energy to further cool the roof and decrease the amount of air conditioning needed to cool the interior space. The objective of the research reported by Zhou et al. was to develop passive daylight radiative cooling to increase the efficiency of condensation of water vapor in dry areas of the world. Water for drinking and other household purposes is often in short supply in such areas and a way to purify salty or otherwise undrinkable water is distillation. A solar still is one way to do this without need for any source of energy except sunlight. The impure water is heated in a black container that absorbs sunlight and gets warmer than the surroundings. The water vapor from the warmed water is condensed and collected on a cooler, ambient temperature, surface. This is an inefficient process that can be made more efficient (more water collected per day) with passive daylight radiative cooling to lower the temperature of the condensing surface below ambient, Figure 8. As climate change makes some parts of the world drier, the need for this kind of technology could grow. The main story of this Activity is that there is an overall global imbalance of energy in versus energy out, caused by increasing atmospheric greenhouse gases, that is warming the planet. But within the wavelength range of infrared emission by bodies at Earth’s temperature, there is a “window” in greenhouse gas absorptions that allows some emitted wavelengths to pass directly into outer space. And this “window” can be exploited locally to passively cool surfaces below ambient temperature, even during the day in direct sunlight. This technology is not going to “solve” global warming or climate disruption problems, but it can be a step on the pathway to eliminating fossil fuel power plants as soon as possible. |
||||||
|
||||||
To obtain a Word file of this Activity, please fill out this brief form to help us track what is happening to our Workbook. We also encourage you to get in touch if you have an activity or idea for an activity that might add to the Workbook. We want to make this an alive and active document. |
||||||
 |
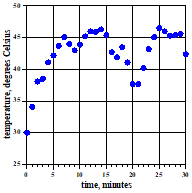 bottle will be a good deal higher than in the water-filled bottle (since the heat capacity of water is so much greater than for air). The result (temperature as a function of time) for an air-filled 2-liter black-painted plastic soft drink bottle sitting in the sun is shown in this graph. (The Activity here suggests smaller bottles, simply to make them easier to handle.) Note that the temperature reaches its maximum in about 10 minutes, except that a cloud passed as it was about to reach the maximum. A larger cloud passing between 15 and 20 minutes caused the larger dip.