Energy transfer, phase change, and temperature
|
Energy transfer, phase change, and temperature |
Essentially every change in the material world involves energy. Either energy must be input to bring about the change, or energy is released as a result of the change taking place. The conservation of energy is a fundamental law of nature. Energy can neither be created nor destroyed. It can be changed from one form to another but always conserved. For example, electrical energy, in the form of an electric current, passed through the filament of an incandescent light bulb increases the motion of the filament electrons, which gets the filament hot enough so it glows and emits radiant (light) energy. A common form of energy is heat, the energy transferred from one object to another due to a difference in their temperatures. The energy transfer is always from the higher temperature object to the lower temperature. Often, the transfer of energy from one object to another is accompanied by temperature changes in both objects. But this is not always the case, especially if phase changes are involved. For example, if a chunk of solid carbon dioxide (dry ice) changes to carbon dioxide gas (sublimes), energy from the warmer surroundings is required to break the molecules in the solid free of their attractions to one another, but the dry ice does not change temperature as it sublimes. Here, we’ll examine phase changes and some of their consequences. |
||||
| A: Solid and liquid water | ||||
|
||||
| Procedure, observations, and analysis | ||||
Half fill the beaker with crushed ice and add enough ice-cold water to three-quarters fill the beaker with the mixture. Add the stir bar, place the beaker on the stirrer, and begin stirring. Clamp the temperature probe at a height that will suspend it in the ice-water mixture (not in the liquid water below the mixture) and immerse it toward one side of the beaker where the mixture is moving well. Make sure the stirring is vigorous and start recording the temperature as a function of time. Taking a point per second for at least 20 minutes should give a good plot to analyze. Go on to Part B, while the stirring and recording are going on. After 20 minutes, stop the stirring and recording, and note what has happened to the temperature during the 20 minutes of stirring. Remove the temperature probe from the beaker and examine the contents of the beaker. |
||||
1.
|
Suppose you put an ice cube in a dish and set it on a table at room temperature. When you return to look at the dish and ice cube later, what change do you expect to see? Does the change involve heat (energy transferred from a warmer to a cooler object/substance)? Explain your response. |
|||
2.
|
Look at a plot of the temperature as a function of time for your data. What happened to the temperature of the ice-water mixture during the 20 minutes of stirring? Is this what you might have expected to see? Explain why or why not. |
|||
3.
|
How did the amount of ice in the mixture after 20 minutes of stirring compare to the amount at the beginning? How were you able to tell? |
|||
4.
|
What change occurred in the ice-water mixture during the stirring? Was heat (energy transferred from a warmer object to a cooler object) involved in the change? From what object(s) or substance(s) did the energy come? To what object(s)/substance(s) did the energy go? Is your reasoning in item 1 relevant here? Clearly explain your responses. |
|||
5.
|
Consider the object to which energy was transferred in the change you identified in item 4. What was the fate of that energy? Did it raise the temperature of the object or did it do something else? Clearly explain the evidence and reasoning for your response. |
|||
6.
|
If you have a mass of ice and the same mass of liquid water, both at the freezing point of water, which one has more energy? Use the evidence from this activity to explain your choice. |
|||
7.
|
The Greek delta symbol, Δ, denotes a change in some variable, always the difference between its final value and initial value. For melting (fusion) of ice, for example, the change in energy is |
|||
8.
|
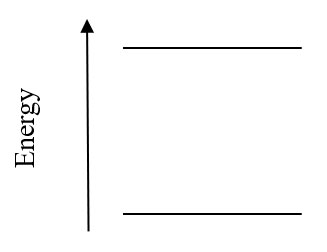
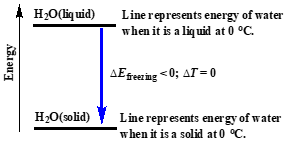
Graphical/pictorial representations of mathematical concepts are often useful to help visualize the concepts. Energy level diagrams are such a device. On this diagram, the horizontal lines represent the relative energies of the same amounts of solid water and liquid water, with the more energetic one higher in energy as shown by the “scale” (arrow) on the left. An arrow that actually connects the two energy levels will represent the change in energy, ΔE, for a change in phase. An upward facing arrow will be a positive energy change and downward, a negative energy change. Label the solid water and liquid water energy levels and draw the arrow that represents ΔEfus. Explain the reasoning for your response. |
|||
9.
|
Draw the energy level diagram for water freezing, liquid water to solid water. How does this diagram differ from the one for fusion? How is it the same? What does ΔEfreezing look like on this diagram? Explain your reasoning. |
|||
B. Liquid and gaseous water |
||||
As background for this activity, you need to know that your skin is not a good thermometer. Your skin senses the loss or gain of energy, not temperature. If your skin loses energy to its surroundings, you sense this as coolness. Conversely, if your skin gains energy from its surroundings, you sense this as warmness. The more rapidly the energy is lost or gained the cooler or warmer, respectively, you feel. Your skin can be fooled. For example, in locations where winters can be cold and windy, weather forecasts often include a “wind chill” factor. Without the wind, your skin would lose energy to the cold surroundings at a certain rate, but when the wind is blowing and removing energy faster, you feel colder, even though the air is still the same temperature. That is, the wind chills you more than the temperature would suggest. |
||||
|
||||
| Procedure, observations, and analysis | ||||
Each member of the group should dampen a paper towel and use it to wet their index (pointer) finger on one hand. Then hold the wet index finger and dry middle finger in a “vee” shape while waving the hand in the air until the wet finger dries. Repeat, if necessary, to confirm the observations, perhaps even changing the roles of the fingers. |
||||
10.
|
Do you feel any difference between the wet and dry fingers? If so, what is the difference? |
|||
11.
|
What do you think caused your fingers to feel different (if they did)? Do you think energy is involved in this observation? Explain your evidence and reasoning clearly. |
|||
12.
|
If energy is transferred in this activity, from what object/substance does energy leave? What is your evidence? |
|||
13.
|
If energy is transferred in this activity, to what object/substance does energy go? What is your evidence? |
|||
14.
|
If the energy change, ΔE, is defined as Efinal – Einitial, what is the sign of the energy change in the skin of your wet finger, positive or negative? Explain your reasoning. |
|||
15.
|
What is the sign of ΔE for the water on your wet finger, positive or negative? Explain your reasoning. |
|||
16.
|
What happened to the water on your skin when you waved your wet finger? (What state was the water in before and after you waved your finger?) How is ΔE for the water (from item 15) responsible for what happens to the water? Where does the energy end up? Explain your reasoning. |
|||
17.
|
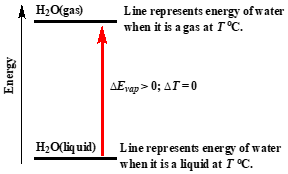
On this energy level diagram, label the line that represents the energy of liquid water. Label the line that represents the energy of water vapor. Explain your choices. Draw an arrow representing ΔE for the evaporation of water from your skin. |
|||
18.
|
Explain how this activity relates to the reason you perspire when you exercise vigorously. |
|||
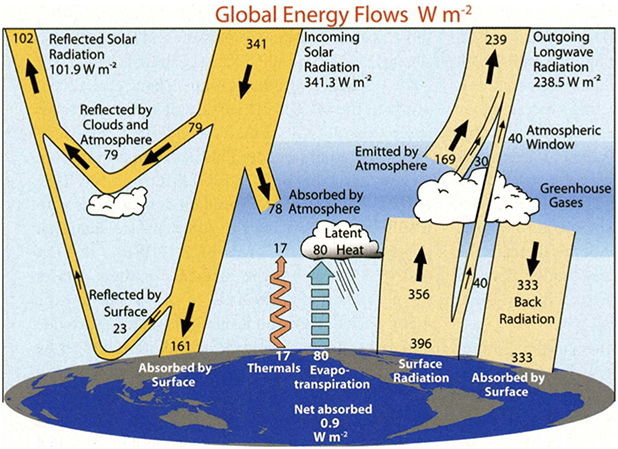
Figure 1 is a schematic diagram of the average energy flows associated with the Earth’s climate system. Fate of Earth’s energy imbalance is a more detailed analysis of the information in these energy flow diagrams. Our interest here is the two small arrows in the center of the diagram. The squiggly orange arrow represents the energy transferred from the surface into the atmosphere by air warmed by contact with the surface and then displaced upward by more dense cooler air. This is energy transfer by conduction and convection. The broken blue arrow represents the gaseous water formed by input of energy to liquid water on the warmed surface (evaporation). Water vapor is less dense than air and is displaced upward. |
||||
|
||||
19.
|
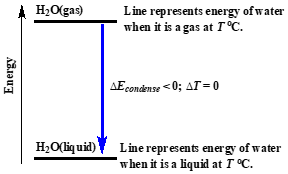
Figure 1 shows the energy from gaseous water added to the atmosphere as “Latent Heat”. What process is going on for the gaseous water to add energy to the atmosphere? How is this shown in the diagram? Draw an energy level diagram (with appropriate ΔE) that represents what happens to the gaseous water. Clearly explain your reasoning. |
|||
 |
||||
Instructor/presenter notes |
||||
The two systems examined in this Activity, change of solid to liquid water and change of liquid to gaseous water, are designed to help understand the characteristics of phase changes and some relationships to the climate. Energy is required to bring about these changes and, conversely, energy is released by their reverse, freezing liquid water and condensing water vapor. The input of energy is easier and simpler to study. A counterintuitive characteristic of phase changes is that they occur without a change in temperature of the substance undergoing the change, even though energy is being added or removed. The most convenient and accessible system for demonstrating this is melting ice, Part A of the Activity. The ideal way to carry out Part A in small groups of students requires you to have enough magnetic stirrers, temperature probes, and data collection and recording devices to equip several groups. All groups should get essentially identical data, thus reinforcing the fundamental idea that phase change occurs without change in temperature. If you do not have enough equipment for individual groups, second best is to set up the system as a demonstration with the temperature projected continuously for the entire class to see. You could run it at a larger scale and for a longer time, if that would help make the fundamental point with your class. If you have stirrers, but not data loggers, groups could set up with digital thermometers (or harder to read liquid-in-glass thermometers) and group members could alternate reading the temperature every three to five minutes. A difficulty to be overcome in studying the ice-water system is the effect of differences in density of the components of the system (which are examined in Density and behavior of ice-water mixtures”). The tendency is for liquid water not intimately mixed with the floating ice to warm slightly (increasing its density) and sink. The solution is to be sure the ice-water mixture is stirred vigorously throughout the time the temperature is being recorded; this is why mechanical stirring is important. (The stirring has consequences, see item 4 below, that you can exploit, if it makes sense for your class.) Two practical considerations for the set-up are the noise made by stirring the ice-water mixture and the possible distraction if you arrange to display the temperature continuously. The stirring noise can be minimized by making sure the stir bar spins freely in the container used for the ice-water mixture. A glass beaker has quite a flat bottom that is pretty much ideal for a spin bar. If you use some other container, choose one with the flattest bottom you can find. The noise can’t be completely eliminated, because the small pieces of ice continuously run into one another and the temperature probe and make clicking sounds. The best you can do is locate the stirring where it will be as little disturbing as possible. Although it’s fascinating (in some sense) to watch the temperature remain unchanging (ideally) for 20 minutes or so, it can be distracting, while trying to focus on Part B of the activity. If you choose to display/project the temperature continuously (either as a complement to the individual group observations or as a demonstration, instead of the hands-on activity), you might want to just show the projected output from the temperature probe every now and then to confirm that it is remaining constant. It will be fortuitous if the temperature is exactly 0 °C or stays exactly at the same temperature, but it should be within a couple tenths of a degree of zero and not vary by more than a tenth or so. You might wish a briefer version of the worksheet that simply provides directions for carrying out the explorations and then using class discussion, modeled on the worksheet question sequence to analyze and draw conclusions from the observational evidence. Drawing appropriate energy level diagrams could be a culminating assessment of understanding phase change. |
||||
Here are the responses we hope to get from the numbered questions. |
||||
| Part A | ||||
1. |
Our experience is that an ice cube left sitting out at room temperature should be either partially or wholly melted when observed at a later time. Experience also tells us it would not melt, if kept at a temperature below 0 °C. So, it must be the case that energy is being transferred from the warmer, room temperature, surroundings to the cold ice cube to melt it. Energy transferred from a warmer to a cooler object is called “heat,” so this change involves heat. The reason for this question to start off the analysis for Part A is to get the students in the right mind set to reason (in item 4) that energy must be entering the ice-water mixture to cause some ice to melt, even though there is no change in temperature. |
|||
2. |
If all goes well, the temperature of the stirred ice-water mixture will have remained constant near 0 °C. Whether students are surprised or not by this observation depends on their prior experiences and perhaps instruction. Some might reason that an iced beverage stays cold, as long as it still contains ice, which is just like what is going on here. Excellent. |
|||
3. |
If the students have had the opportunity to examine the ice-water mixture before stirring began, a decrease in the amount of ice after stirring should be obvious in the reduced thickness of the floating ice layer. You might mark the bottom of the layer on the outside of the container before stirring, so the decrease is even more obvious. |
|||
4. |
During the stirring, some solid water disappeared and must have changed to liquid water without a change in the temperature of the mixture. The cold solid (ice) was in a container surrounded by room temperature air (and stirrer). Transfer of energy from the warmer surroundings to the cold solid would be expected, as discussed in item 1, and caused the change to a liquid. The question in this item is put in terms of energy transfer as heat from a warmer to cooler object, because that is likely to be what is most familiar to students thinking about melting ice and that is just fine. However, in this case, there is another source of energy that is at least as important, the mechanical work done on the system by stirring. |
|||
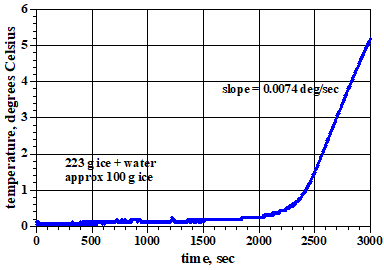
If you have introduced or wish to introduce the experiments that James Joule did to establish the relationship between work and heat, consider the extended activity represented in Figure 2. |
||||
|
||||
The straight line (almost) section of the plot at the right is the increase in temperature of 223 g of cold water as it is stirred and energy is added from the warmer surroundings. Using the specific heat of water, the slope can be converted to joules: energy flux = (0.0074 deg/sec) (4.194 J/g•deg) (223 g) = 6.9 J/sec If we assume that this energy flux is the same throughout the 50 minutes, the energy added to the ice-water mixture during the ice melt, approximately the first 2000 seconds, is: energy added to melt ice = (6.9 J/sec) (2000 sec) = 1.38 x 10⁴ J And for about 100 g of ice melted: But the energy (or enthalpy) of fusion of ice is 334 J/g. The value we just calculated is less than half as large. Where does the extra energy required to melt the ice come from? Remember the noise heard when the ice-water mixture is stirred? To create the noise, something has to be vibrating to set up sound waves, and that something is the pieces of solid ice banging together as the mixture is stirred. The mechanical motion of stirring is transformed into extra motion of the molecules in the ice, which gives the molecules enough energy to leave the solid and become part of the liquid. This story may be too much for some classes, but highlights the often neglected transformation of mechanical energy to molecular motion and its consequences. |
||||
5. |
The reasoning in item 4 is that the energy transferred to the ice-water mixture went into the solid ice, causing it to melt. This item specifically asks students to consider the possibility that the temperature of the mixture is affected by the input of energy, so they are forced to explicitly confront the observation that there is no temperature change. If the input of energy does not change the temperature, what happens to it (since it cannot be lost)? The energy must be present in the liquid water formed from the melted solid and captured as motions that give the liquid the same temperature as the ice from which it formed. |
|||
6. |
The reasoning in item 5 is that liquid water, formed from melting ice at 0 °C, contains the energy required to cause the melting. Thus, a given mass of liquid water at 0 °C has more energy than the same mass of solid water at 0 °C. That is, Eliquid > Esolid. |
|||
7.
|
If ΔEfus = Eliquid – Esolid and Eliquid > Esolid, then ΔEfus is positive. That is, ΔEfus > 0. |
|||
8.
|
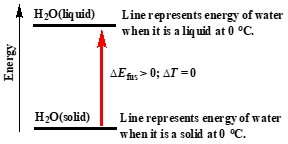
The relative relationships among Eliquid, Esolid, and ΔEfus from item 7 are captured in this energy level diagram, where the upward ΔEfus arrow indicates a gain in energy for the system undergoing the phase change. When a quantitative value is given for ΔE in an energy level diagram, it is usually given for a mole of the substance undergoing the change. For water, for example, ΔEfus = 6.00 kJ/mol. (This is actually ΔHfus, the enthalpy of fusion, but the two are almost identical for changes between condensed phases, where the volume change is very small.) |
|||
9. |
This is the energy level diagram for water freezing, liquid → solid. |
|||
The energy levels for liquid and solid water at 0 °C are exactly the same as in item 8. The direction of phase change does not change the energy contained in each phase, so the difference in energy between the two phases is the same. What is different is the direction of the energy change arrow. Since energy must be given up by the liquid in order to change to the solid, the change must be for the system to lose energy to the surroundings. Thus, the energy change, |
||||
| Part B | ||||
A wet finger on a hand waved in the air feels cooler than a dry finger on the same hand. This is the reason sweating, which wets the skin, has a cooling effect as energy is transferred from the skin to the water (sweat), causing it to change phase (vaporize) and carry the energy away. That is, instead of the water on the skin getting warmer, the energy it gains goes into breaking the attractions that hold the molecules in the liquid and producing gaseous water without a change in temperature. Skin is a poor thermometer. Skin senses energy change, not temperature directly. If energy leaves one part of the skin (say, a finger) more rapidly than another (say, another finger), the first finger will feel cooler. Conversely, if energy enters more rapidly, the sensation will be warming. If students are skeptical about this, here is a simple, but kind of dramatic, way to prove that the skin is an unreliable thermometer. |
||||
|
The requirements are a bowl or basin of room temperature water large enough to immerse one’s whole hand, a glass of very cold water, and a similar glass of very warm water. Set the two glasses close to one another so it will be possible to immerse the index and middle finger in one glass and the other two fingers on the same hand in the other glass. Begin by having the person who will do the test immerse her/his hand in the room temperature water for about 10 seconds to get a good sense of what it feels like (the temperature). Then immerse the fingers of that hand in the two glasses, as described, for about 90 seconds. Quickly move the experimental hand from the glasses back into the room temperature water. Describe what is felt. The fingers that were in the cold water will feel warm and those that were in the warm water will feel cool, even though both are in the same temperature water. The warm and cold temperature baths have made the skin on the fingers warm and cold, respectively. So energy leaves the warm fingers to go to the lower room temperature water and these fingers feel cool. Conversely, energy enters the cold fingers from the warmer room temperature water, so these fingers feel warm. The skin is “fooled” into sensing that the temperature bath is both warm and cool. |
|||
10. |
The wet finger feels cooler than the dry finger. |
|||
11. |
Since the wet finger feels cooler, energy must be leaving its skin at a greater rate than from a dry finger waved at the same time in the same location. Both fingers perhaps lose some energy to the air that rushes by them, but there must be some extra way for the wet finger to lose energy. Considering the possible energy lost to the air adds unnecessary complexity to the reasoning about this phenomenon, so you might wish to ignore it. If students bring it up, you can ask whether they really feel any difference in temperature of their dry fingers held still or waved in the air. |
|||
12. |
Energy must be leaving the wet finger, since it feels cooler. |
|||
13. |
The only difference between the wet and dry fingers is the water on the wet finger, so the energy leaving its skin must be going to the water. |
|||
14. |
Energy is leaving the skin of the wet finger, so its final energy must be less than its initial energy; that is, Efinal < Einitial. Thus, for the skin, |
|||
15. |
Since energy is entering the liquid water on the skin, the water is gaining energy, so after the transfer, Efinal > Einitial and ΔE = Efinal – Einitial > 0. ΔE (water) is positive. |
|||
16. |
After waving the hand in the air, the wet finger dries, so water leaves the wet finger. The water on the finger was liquid, but it must have become a gas when it left to mix with the air, since it “disappears” and we know water vapor is invisible. Energy is required for the water molecules in the liquid to break free of their attractions to the other water molecules and enter the gas phase. The energy that entered the liquid water, item 14, must provide the energy required for the change from liquid to gas—evaporation. The energy is no longer in liquid water, but has ended up in gaseous water. So, Egas > Eliquid and ΔEvap =Egas –Eliquid> 0. ΔEvap is positive. |
|||
17. |
On the energy level diagram for vaporization, the energy level for the gas has to be higher than that for the liquid, since (as we argued in items 15 and 16) energy was added to bring about the phase change. This is shown in this diagram, where the phase change is represented by the upward facing arrow labeled “ΔEvap > 0”. This diagram is qualitatively similar to the one for the solid-to-liquid fusion phase change in item 8, with differences in the meanings of the energy level lines and energy change arrow to reflect the different phase change. The spacing between the levels here for evaporation is also larger than the difference for fusion. The energy of vaporization, about 44 kJ/mol (near room temperature), is a good deal larger than the energy of fusion, 6.00 kJ/mol, item 8. There is no attempt here to show this large difference quantitatively, but just to indicate and reinforce the direction of the difference. (The value here is actually ΔHvap, the enthalpy of vaporization. For changes involving a gas, as here, the energy and enthalpy change can be different by several kilojoules and are usually temperature dependent. The difference is irrelevant to the discussion here, but keep it in mind in other cases.) |
|||
| 18. | When you exercise vigorously, your metabolic rate increases to produce the energy needed for the exercise and also acts to raise your body temperature. To try to maintain a normal temperature, the body releases water (sweat) to wet the skin, which absorbs energy from the skin and changes to water vapor to carry the energy away. This familiar phenomenon could be used to introduce Part B of this Activity with the challenge to understand why a person sweats and how it accomplishes its purpose. | |||
19. |
“Latent” means “hidden”, as in latent fingerprints that are invisible and can only be “discovered” by the application of some form of developer. “Latent heat” (hidden heat) is energy that is released or absorbed by a system that undergoes a change at constant temperature, notably phase changes. The term was coined by Joseph Black, 1728-1799, a Scottish physician and chemist, who made careful studies of changes that occur without a change in temperature, including the transformation of solid water to liquid water, just as in Part A of this Activity. (Black was an excellent experimentalist who invented the analytical balance, discovered carbon dioxide, developed the limewater test for the gas, and found that animal respiration and microbial fermentation produced the gas.) The broken blue arrow in the diagram begins at the surface of the Earth where the warmed surface transfers energy to liquid water on the surface to change it to gaseous water. A great deal of water is also evaporated through the pores of plant leaves. One of the reasons is to keep the plant from overheating on hot, sunny days. (Sort of like plants sweating.) Water vapor is less dense than air and is displaced up into the atmosphere by the denser air, carrying with it the energy required to change from liquid to gas. The temperature of the atmosphere decreases with altitude, so when water vapor gets high enough, it begins to transfer energy to the cold surrounding air and condense as liquid water. Very tiny droplets of water form clouds, which are represented in the diagram. Under the right conditions, these microdroplets combine to form larger drops that fall back to the surface as various forms of precipitation. This is represented in the diagram by the several lines extending downward from the cloud. The upshot is that energy transferred from the surface to evaporate liquid water is transferred to the atmosphere when the water vapor condenses high above the surface. The energy level diagram for the condensation phase change that occurs in the atmosphere is the same as the diagram for vaporization in item 17, with the exception of the sign of ΔE and direction of the energy change arrow. |
|||
| Note: You can find several versions of the global energy flows diagram shown in Figure 1 in publications and on internet sites. They generally differ slightly in the specific values attached to the flows, since these depend on the exact methods used to derive them and when the calculations are done as the Earth continues to warm. Another, slightly more recent version, is used in Global warming and greenhouse effect background, and Heat capacity and fate of Earth’s energy imbalance. The graphics in each version are a bit different, even though the phenomena represented are the same. The version for Figure 1 was selected because it shows the latent heat transfer of energy from the surface to the atmosphere in a way that seems most easily interpretable in terms of the changes that are occurring. |
||||
An Extension |
||||
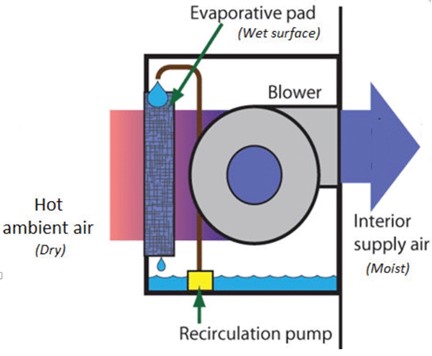
Humans (and other animals) use evaporative cooling, that is, sweating and vaporization of the water, to help maintain a constant temperature. The planet itself uses evaporative cooling to carry energy away from the sun-heated surface to help maintain a temperature suitable for life. Intermediate in scale between the individual and the planet are many other uses for evaporative cooling. One use is in the evaporative cooling devices, often called “desert coolers”, shown schematically in Figure 3. |
||||
|
||||
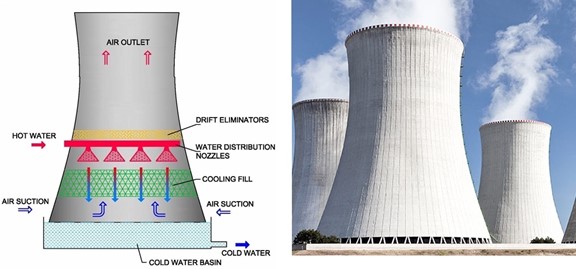
In the simplest and least expensive of these coolers, the wet pad that water trickles through to keep wet can be straw or fine wood shavings that are replaced periodically as they decay. More expensive, permanent materials for this purpose include the sort of porous ceramics discussed in the article where the diagram appears. The great advantages of these coolers are their simplicity and much lower power requirement than gas-compression air conditioners. Their major drawback is that their principle of operation, evaporative cooling, works most efficiently in hot, arid climates, like the southwestern United States, and is not very useful in cooler, wetter climates, like New England. A characteristic that can be good or bad, depending on one’s viewpoint, is the fact that the cool air inside a room will be humid. In an arid climate, one might find this comfortable and pleasant. Others, however, might think this unpleasantly “clammy”. This might be the origin of the name “swamp coolers” (making a room feel like a swamp). Or it could refer to the odor, if the water and mat are not kept clean, so mildew, mold, and fungus build up. Still, with solar power and battery storage for night operation, desert coolers provide a greenhouse-gas-free way for many places to stay cool in a warming world. On a good deal larger scale, the cooling towers, Figure 4, that are familiar near electricity generating plants also work on the principle of evaporative cooling. But they work to do just the opposite of what the desert coolers do—they end up cooling water and heating air. Regardless of the source of energy (coal, gas, or nuclear), these plants use the energy from combustion or nuclear fission to boil water (liquid to vapor phase change) and use the steam to turn turbines that turn generators to produce electricity. The maximum amount of energy can be captured to turn the turbines if the steam is condensed to water as it’s leaving the turbines. To remove the necessary energy (see item 19) as quickly as possible, the condenser coils are surrounded by cold water to take up the energy. Vast amounts of cold water are required for this cooling, which is why these plants are almost always sited next to rivers or large bodies of water. This cooling water is, of course, heated by the uptake of energy and has to be cooled for reuse or discharge into the body of water from which it came. That’s where the cooling towers come into play. |
||||
|
||||
One environmental impact that all steam turbine power plants share is thermal pollution of the water body from which their cooling water is drawn and to which it is returned. Typically, the return water (after passing through the cooling tower) is at temperature somewhat above 30 °C. This is warmer than any river, lake, or sea from which the water is drawn, so the temperature of the source is upset, which generally has negative effects on the aquatic animal and plant life in the area of the water source that gets warmed. This is yet another reason for transitioning as soon as possible to energy sources that do not emit greenhouse gases or warm effluent water. Here is one final note about why the vaporization phase change is so important in these cooling towers. As an example, say the hot water enters the tower at about 90 °C and we want it to leave at about 30 °C. To lower a mole of liquid water by 60 °C, we need to remove (18 g/mol)(4.184 J/g•deg)(60 deg) = 4.5 kJ This is the energy that will be carried away by the flowing air. If that mole of water had vaporized, the gas would have carried away about 40 kJ of energy, enough to lower the temperature of about nine moles of water by 60 °C. (In other words, out of ten moles of hot water, vaporization of one mole would carry away enough energy to cool the remaining nine by several tens of degrees.) Compared to the usual energy transfers between different temperature objects, the energies involved in phase changes are startlingly large. This is because they almost always involve breaking or making interactions among molecules that take up or give off substantial amounts of energy (like the extensive hydrogen bonding among water molecules in their solid and liquid phases). Be on the lookout and counsel your students also to be alert for more phenomena that depend on phase change, energy transfer without temperature change. Note: Passive radiative cooling is another, quite different, cooling technology. It does not involve phase change and requires no input of energy, but cools by emitting unwanted energy (as infrared radiation) directly into outer space. A brief introduction and references for more information are available in Part E of Heat capacity and fate of Earth’s energy imbalance. |
||||
|
||||
To obtain a Word file of this Activity, please fill out this brief form to help us track what is happening to our Workbook. We also encourage you to get in touch if you have an activity or idea for an activity that might add to the Workbook. We want to make this an alive and active document. |
||||
| Back to Table of Contents | ||||
 |