Earth’s internal energy and atmospheric argon
|
Earth’s internal energy and atmospheric argon |
Nuclear energy |
||||||||||||||||||||||||||||||||||
Millions of miles away from Earth, nuclear fusion reactions drive the gigantic power plant, our Sun, sending huge quantities of solar energy to our planet and the rest of the solar system. Here on Earth, we use a different nuclear process, fission, as the energy source for nuclear reactor power plants. And a third process, nuclear decay, is producing tremendous amounts of heat energy inside our planet. Let’s take a brief look at these processes. |
||||||||||||||||||||||||||||||||||
Nuclear fusion |
||||||||||||||||||||||||||||||||||
Deep inside the Sun, at extremely high temperature and pressure, the net nuclear reaction that produces most of the energy is 4 1p+ → 4He2+ + 2 0e+ ΔE = –25.73 MeV = –2.48 x 10¹² J/mol The nuclei are designated by their elemental symbols with their mass number (number of protons plus neutrons) shown by the preceding superscript and charge (number of protons) by the succeeding superscript. The 1p+ is a proton (an 1H+ nucleus) and 0e+ is a positron, a positively charged particle with the same mass as an electron. In a balanced nuclear reaction expression, the mass numbers and charges must balance. Check to see that this expression is balanced. (Note that we have not shown the gamma rays, γ, and neutrinos, ν, that carry away most of the reaction energy, because they are not needed for balancing the nuclear reaction expression.) The energy change for nuclear reactions is usually given in electron volts, eV. or, often, in millions of electron volts, MeV (= 106 electron volts), since the energy changes are so large. These energies refer to a single event, for example, the formation of one 4He2+ in the reaction here. To convert to a more familiar energy unit, use the Faraday constant, 96,500 J/eV•mol. Here we get ΔE = (–25.73 x 10⁶ eV)(96,500 J/eV•mol) = –2.48 x 10¹² J/mol The energy change is negative, showing that these are exothermic reactions. The energy produced in nuclear reactions comes from the conversion of mass to energy, ΔE = (Δm)c2, where Δm is the change in mass (product mass minus reactant mass) and c is the speed of light. See Appendix A. |
||||||||||||||||||||||||||||||||||
Nuclear fission |
||||||||||||||||||||||||||||||||||
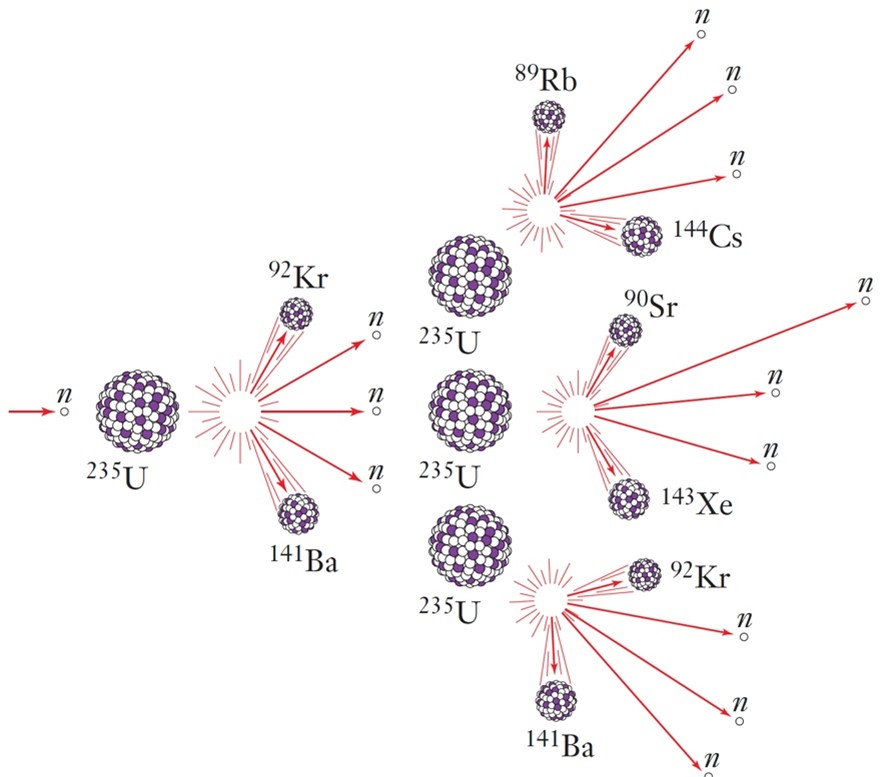
A few of the heavy periodic table elements have nuclei that undergo spontaneous fission, breaking apart into lighter nuclei. The fission reaction can be stimulated by collision with a neutron, 1n0, as in this uranium-235 example from Figure 1: 235U92+ + 1n0 → 141Ba56+ + 92Kr36+ + 3 1n0, This split of the 235U92+ nucleus is typical, but many others also occur that yield other elemental nuclei, generally clustered around the mass numbers of the product isotopes shown in this example. Note that one reactant neutron produces three product neutrons. In a sample with lots of 235U92+, this single event can trigger three more, then nine more, then… a chain reaction, as shown in Figure 1. In a nuclear reactor, the chain is controlled by capturing some of the neutrons to slow the chain and the energy released is used to produce electricity. In an atomic bomb, the chain is not controlled, and the enormous energy release creates an explosion. (We have not yet been able to produce controlled nuclear fusion reactions for power generation. But we have created uncontrolled fusion reactions triggered by an atomic explosion to produce so-called hydrogen bombs.) |
||||||||||||||||||||||||||||||||||
|
||||||||||||||||||||||||||||||||||
Nuclear decay |
||||||||||||||||||||||||||||||||||
Unlike nuclear fission reactions, the products of nuclear decay reactions always yield the same products from a given radioactive isotope. In a sample of some radioactive isotope, we don’t know which nuclei will decay next, but we know that the time required for half of them to decay is the same for any size sample. These decays are characterized by their half-lives, τ. A nuclear decay reaction of thorium-232 that occurs inside the Earth is 232Th90+ → 228Ra88+ + 4He2+ τ = 1.41 x 10¹⁰ yr = 14.1 Ga (Ga = billion years) The half-life for this decay is comparable to the age of the universe. Usually, when a helium nucleus is a product of radioactive decay, it’s called an alpha particle, α. The 228Ra88+ product of this reaction is itself radioactive and decays by a relatively rapid series of nuclear decay reactions to finally produce the stable lead-208 isotope. Thus, the net decay for thorium-232 is 232Th90+ → 208Pb82+ + 6 4He2+ + 4 0e- An electron, 0e-, produced by a radioactive decay is usually called a beta particle, β. It’s easier to balance nuclear reaction expressions if the identities of the particles, α and β, are shown explicitly. Show for yourself that this reaction is balanced. The energy release by this decay is discussed in Appendix A. |
||||||||||||||||||||||||||||||||||
Inside the Earth |
||||||||||||||||||||||||||||||||||
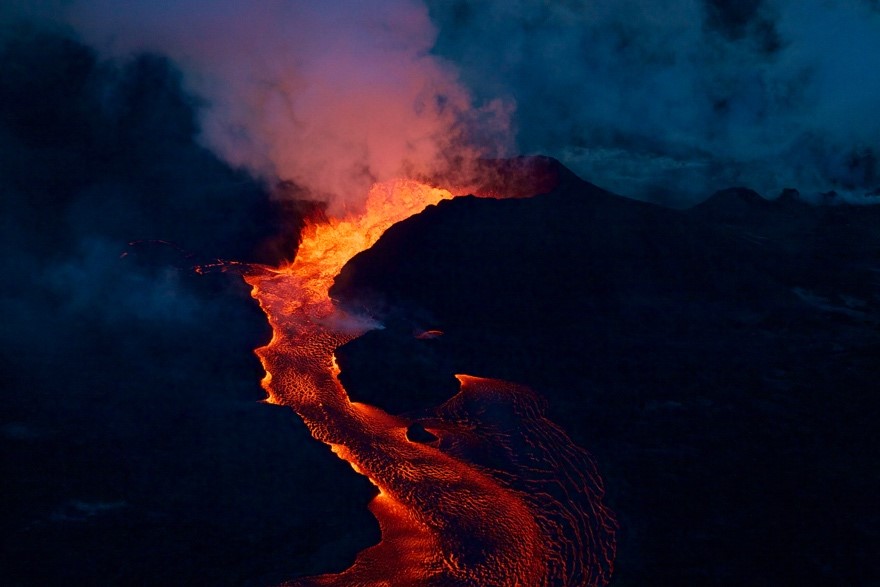
The interior of the Earth is hot enough to create the magma (molten rock) on which the solid crustal plates float and move ever so slowly (plate tectonics). The magma sometimes breaches the crust in spectacular lava flows, as in Figure 2. Earth’s metallic core (iron, nickel, etc.) is also at least partially molten, as it must be to produce the planet’s magnetic field. Earth is about 4.5 billion years old and has had time to lose the thermal energy it was born with, so something must be furnishing energy to keep its insides molten. |
||||||||||||||||||||||||||||||||||
|
||||||||||||||||||||||||||||||||||
Energy and energy transformations are central to understanding climate science and climate disruption. These include the energy in infrared, visible, and ultraviolet light, fossil fuel burning, nuclear fission and decay, conduction and convection of thermal energy. Long-lived radioactive nuclei are the Earth’s interior energy sources. The most important nuclei and their half-lives are: potassium-40 1.25 x 10⁹ yr The following activities and discussions are related to questions about Earth’s internal nuclear energy properties. How does the energy produced from inside compare to the energy from the Sun on the outside? Could it be causing climate change? Can this energy be harnessed for human use, without nuclear power plants, to reduce our dependence on the burning of fossil fuels? Are there observable consequences for the Earth (besides energy production), such as the composition of the atmosphere, that help us learn about the nuclear decays occurring deep beneath our feet? |
||||||||||||||||||||||||||||||||||
A. Potassium-40 radioactive decay |
||||||||||||||||||||||||||||||||||
Potassium-40 (K-40), is one of the most common radioactive nuclei in our environment (natural isotopic mass abundance 0.0117%). With a half-life of 1.25 x 10⁹ yr (1.25 Ga), K-40 decays by these routes, beta (electron) decay and electron capture (a valence electron reacts with the nucleus to transform a proton to a neutron). The fraction of decay by each pathway and the maximum energy release are shown in parentheses. 40K19+ → 40Ca20+ + 0e- (89.3%, 1.211 MeV) Most animals contain a substantial amount of potassium that is essential for many metabolic processes and is responsible for most of the radioactivity your body emits. A 70 kg human, for example, contains about 140 g potassium, which has 0.0117% K-40. |
||||||||||||||||||||||||||||||||||
1.
|
(a) What is the mass of K-40 in this person? (b) How many K-40 nuclei are present in this person? As you know, radioactive decay is a first order process: (c) What is τ, the K-40 half-life, in seconds? (d) What is the rate of decay, the number of decays per second, in this person? |
|||||||||||||||||||||||||||||||||
This is the amount of radioactivity (beta particles and gamma rays) emitted every second throughout this person’s life, since the amount of potassium in our bodies is well regulated to remain always about the same. Other things in our environment that contain K-40, aside from us, are foods high in potassium, like bananas and potatoes. The largest store of potassium (and, hence, K-40) on Earth is in the rocks and minerals that make up its crust and mantle. We will say more about this below. |
||||||||||||||||||||||||||||||||||
An atmospheric puzzle |
||||||||||||||||||||||||||||||||||
Another topic that figures prominently in climate science is the composition of Earth’s atmosphere, especially the carbon dioxide and its changing abundance (about 418 ppm in 2021). However, little is usually said about the higher abundance components. In dry air (no water vapor), argon is next most abundant, 0.934% = 9340 ppm (by volume). |
||||||||||||||||||||||||||||||||||
2.
|
There are 1.8 x 10²⁰ moles of gas in the Earth’s atmosphere (Appendix B). How many moles of argon are there in the atmosphere? |
|||||||||||||||||||||||||||||||||
More than 99% of the argon in Earth’s atmosphere is argon-40 (Ar-40). In the universe, nuclei (except hydrogen and a portion of the helium and lithium, which were produced in the Big Bang about 13.8 billion years ago) originate by nuclear fusion in stars and supernovae. The argon in our Sun is about 85% argon-36 and 15% argon-38. There is essentially zero argon-40. A similar composition is found in meteorites that are thought to represent close to the ratio of argon isotopes in the universe as a whole. Since it seems not to be formed by nucleosynthesis in stars, where does all the atmospheric Ar-40 on Earth come from? Since there are only trace amounts of Ar-36 and Ar-38 on Earth, the primordial amount present when the planet formed 4.5 billion years ago was probably lost, along with other gases and volatile compounds, from the intensely hot mass of accreting matter. The Ar-40 here now must originate from some planetary source. Could the nuclear reaction of K-40 to produce Ar-40 be that source? Is there (or has there been) enough K-40 to produce all of the Ar-40 (about 1%) in Earth’s atmosphere? The answers lie inside the Earth, in its mantle. |
||||||||||||||||||||||||||||||||||
B. Energy and argon from below |
||||||||||||||||||||||||||||||||||
Earth's nuclear power |
||||||||||||||||||||||||||||||||||
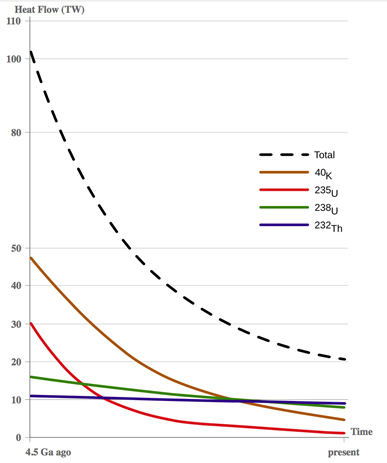
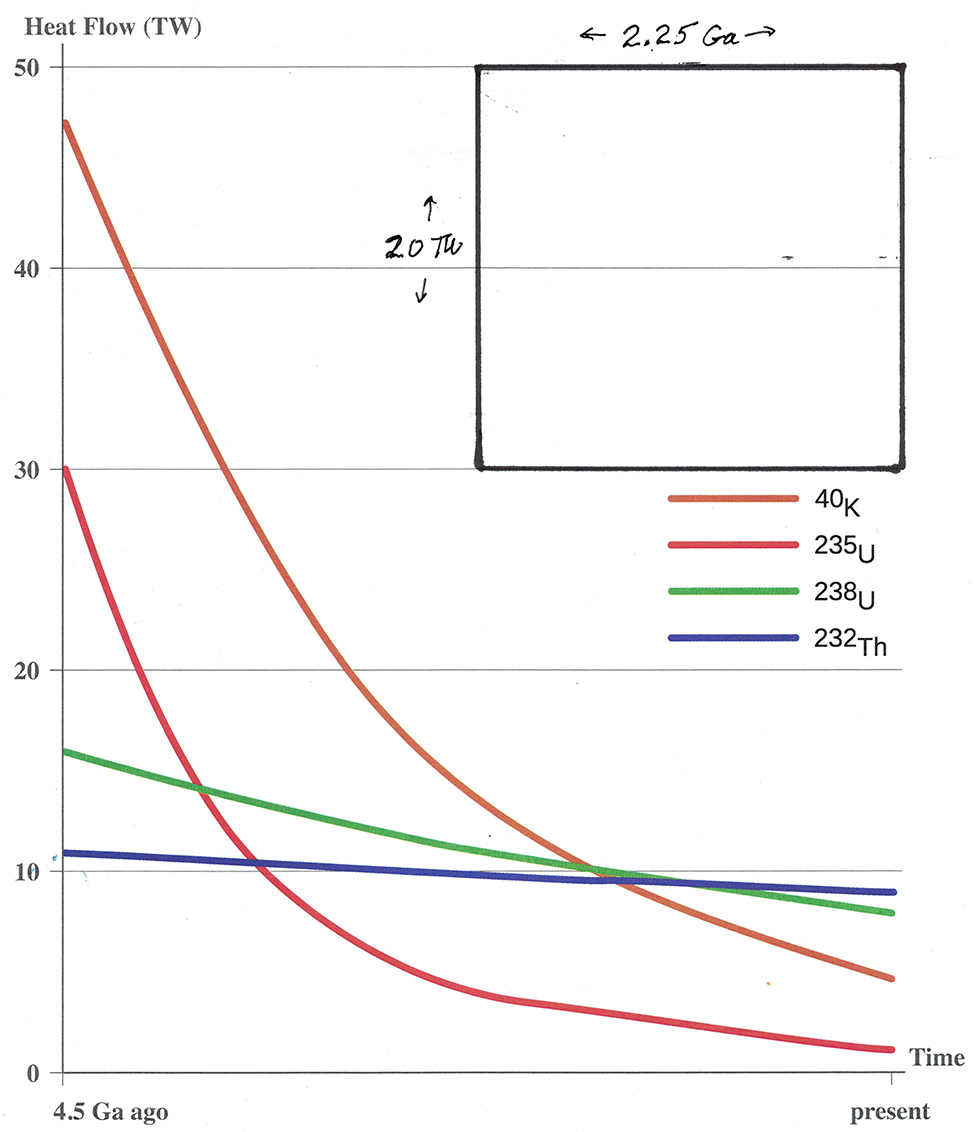
Radioactive decay energy keeps the mantle hot. The nuclei involved and their contributions to the energy since the formation of the planet are shown in Figure 3. The rate of energy release is given in terawatts, TW, 1012 watts, and the time axis is 4.5 billion years, Ga, Earth’s lifetime. |
||||||||||||||||||||||||||||||||||
|
||||||||||||||||||||||||||||||||||
For a little over half of the Earth’s life, K-40 was the largest contributor to the energy that heats the mantle and escapes slowly to the surface. It escapes over the whole Earth, but not evenly, as there are “hot spots” of geothermal activity (volcanoes, geysers, hot springs, and so on) scattered here and there, Now, after almost four half-lives, most of the original K-40 has decayed and much longer-lived uranium-238 and thorium-232 contribute most. Sometimes you hear the argument that global warming is caused by energy from inside the Earth, not human activities like fossil-fuel burning that add atmospheric CO2 and increase the greenhouse effect. The radiogenic energy represented in Figure 3 is roughly half the total amount of energy available from the interior (other half from radioactivity in the core). During the past 50 years, the increased greenhouse effect from human-produced gases has added about 300 zettajoules (1 ZJ = 1021 J) of extra energy to a warming Earth (water, land, and air). To compare the energy from the interior with this exterior warming, we need to convert watts to joules; |
||||||||||||||||||||||||||||||||||
3.
|
(a) How many seconds in 50 years? (b) How much energy (joules) have come from the interior of the Earth in the past 50 years (the “present” on the plot)? (c) How does the energy from the interior compare to the extra energy the Earth has gained from the greenhouse effect in the past 50 years? (d) Could energy from the interior cause the observed global warming? How would you respond to this argument against human-caused global warming? |
|||||||||||||||||||||||||||||||||
4.
|
(a) At present, the total amount of energy produced by all human activity each year is equivalent to about 19 TW. At least twice this amount of energy reaches the surface from the Earth’s interior (magma and core) each year. Is this energy from the interior going to waste? Could harnessing the Earth’s interior energy help reduce dependence on CO2-emitting energy sources? Do you see any problems trying to do this? Explain. (b) Search for information on geothermal power plants and ground-source heat pumps. Explain how what you learn is relevant to the questions in part (a). |
|||||||||||||||||||||||||||||||||
Earth's argon-40 |
||||||||||||||||||||||||||||||||||
|
||||||||||||||||||||||||||||||||||
Knowing that a great deal of energy has been given off by the decay of K-40 over billions of years does not answer the question of how much Ar-40 has been produced. We need somehow to convert the amount of energy to number of nuclei that decayed to produce the energy. We are faced with the task of relating watts (terawatts) and electron volts (MeV) to moles. We saw in the opening paragraphs of this worksheet that eV can be converted to J/mol, using the Faraday constant, 96,500 J/eV•mol. This converts eV to joules, which can be related to watts, as we saw above. These relationships are enough to get a rough, but reasonable, estimate of the amount of primordial K-40 that has decayed since the Earth formed. With appropriate unit conversions, the area under the K-40 decay curve (the total energy produced by the K-40 decay since the Earth was formed) can be expressed in W·s units. You can estimate this area using the plots on the graph following Appendix B. The dimensions of the rectangle are known, 20 TW by 2.25 Ga, so its area in W·s units can be calculated. The ratio of the area under the K-40 decay curve to the area of the rectangle can then be used to find the desired W·s units for the K-40 decay. A simple technique for finding this ratio is described in the next paragraph. Carefully cut out the rectangle and the area under the K-40 decay curve (area enclosed by the K-40 curve, the axes, and the right-hand margin at “present” time). The rectangle has an area of 45 TW·Ga [= (20 TW)(2.25 Ga)]. Assuming that the paper has a uniform thickness and density, the ratio of the mass of paper within the rectangle to the mass of paper within the K-40 decay can be used to get the area under the decay curve. (This is a “mechanical” way to accomplish what one does in the calculus, integration to find the area under a curve.) |
||||||||||||||||||||||||||||||||||
5.
|
What is the ratio of the mass of paper under the K-40 decay curve to the mass of the rectangle of paper? |
|||||||||||||||||||||||||||||||||
6.
|
What is the area of the rectangle in W·s units (that is, joules)? What is the area under the K-40 decay curve in joules? Show your reasoning clearly. |
|||||||||||||||||||||||||||||||||
7.
|
When K-40 decays, about 90% emits 1.211 MeV and 10% 1.505 MeV. What’s the “average” energy of K-40 emission in eV? What is the energy in joules released by one mole of K-40 decays? |
|||||||||||||||||||||||||||||||||
8.
|
Use the results from items 6 and 7 to find the number of moles of K-40 that have decayed since the Earth formed. One tenth of these decays produced Ar-40. How does this production of Ar-40 compare to the amount in the atmosphere today (from item 2)? Is it reasonable to accept the decay of primordial K-40 as the source of the Ar-40 on Earth today? Explain your reasoning. |
|||||||||||||||||||||||||||||||||
Conclusion |
||||||||||||||||||||||||||||||||||
Humans use a lot of energy to power their activities. The ultimate source of the great majority of this energy (heat from fossil fuel burning, solar, wind, and hydroelectric) is the Sun’s nuclear fusion reactions. The Earth contributes its own nuclear fission energy to the mix especially in the form of nuclear power reactors. Often missing in these energy discussions are the past and possible future roles of other earthly nuclear reactions. The power of the analysis in this Activity is that it demonstrates how disparate and, at first, seemingly unrelated properties of our planetary home may, in fact, be related and the relationship can be quantified. In complex systems like the climate, it’s important to be alert for these kinds of interrelationships that can help understand better what affects what and by how much. Understanding the processes that occur naturally on Earth and the interconnections among them is where you can start to understand the ways human activities can interact with and possibly alter them, either accidentally or by design. Humans evolved naturally and are, of course, part of nature. Essentially all organisms alter their environment to some extent in order to survive. Humans, having evolved mental capacities far beyond other organisms, have gone far beyond them by exploiting the environment, not just surviving. We are now faced with the consequences of the exploitation, and ironically, where an understanding of the way the world works may be necessary for survival. |
||||||||||||||||||||||||||||||||||
Appendix A. Nuclear reaction energies |
||||||||||||||||||||||||||||||||||
Fusion energy |
||||||||||||||||||||||||||||||||||
In the opening section of the worksheet, we said that the energy produced by nuclear reactions comes from the famous Einstein conversion of mass to energy relationship, ΔE = (Δm)c2, where Δm is the change in mass (product mass minus reactant mass) and c is the speed of light. Let’s see how the energy released by the Sun’s nuclear reaction, 4 1p+ → 4He2+ + 2 0e+, is calculated. To find the change in mass, Δm, the mass of four protons must be subtracted from the mass of a helium nucleus and two positrons. The mass of nuclear particles is usually given in atomic mass units, u (also called daltons, Da), which are defined as 1/12 the mass of a carbon-12 atom. The mass of a mole of carbon-12 is exactly 0.012 kg, which contains Avogadro’s number, 6.023 x 10²³, of atoms (or particles), so one atomic mass unit, in kilograms, is This can be rearranged by multiplying both sides by by Avogadro’s number: (1 u)( 6.023 x 10²³) = 1 x 10⁻³ kg This equation shows that one mole of atomic mass units is equal to 1 x 10⁻³ kg. We will use this equivalence to convert nuclear reaction mass changes in atomic mass units to kilograms for use in the Einstein mass-to-energy relationship. The masses of the three particles in the nuclear reaction are:
Δm = 4.002603 u + 2 (0.000549 u) – 4 (1.007825 u) The energy change, ΔE, in joules (1 J = 1 kg·m2/s2) is ΔE = (–2.76 x 10⁻⁵ kg/mol)(3.00 x 108 m/s)2 = –2.48 x 10¹² J/mol This is a large amount of energy, equivalent to the energy released by the explosion of about 600 tons of TNT (about a twenty-fifth the energy released by the Hiroshima atomic bomb). To express the nuclear reaction energy change in electron volts, often used for nuclear reactions at the atomic level, we use the Faraday constant, 96,500 J/eV·mol, to convert J/mol to eV: Comparisons among nuclear reaction energies can be made in either joules or electron volts, whichever is more convenient. |
||||||||||||||||||||||||||||||||||
Fission energy |
||||||||||||||||||||||||||||||||||
Having looked at the Sun’s fusion reaction, now let’s calculate the energy released by the initiating fission reaction example in Figure 1: 235U92+ + 1n0 → 141Ba56+ + 92Kr36+ + 3 1n0
Δm = (140.914411 u) + (91.926156 u) + 2 (1.0086649 u) – (235.0439299 u) Note that there is one reactant neutron and three product neutrons, so the net change is a gain of two neutrons included in the mass loss calculation. ΔE = (–1.86033 x 10⁻⁴ kg/mol)(3.00 x 108 m/s)2 = –16.7 x 10¹² J/mol The product nuclei from 235U92+ fission have atomic numbers clustered near those in this example and the energies released are similar to the energy calculated here. Two other fission reactions are shown in the Figure 1 chain reaction. |
||||||||||||||||||||||||||||||||||
A1.
|
Show that the two other nuclear fission reactions release about the same energy as we have calculated above. You can do a Google search to find the masses of the relevant isotopes. for example, search “mass Rb-89”. |
|||||||||||||||||||||||||||||||||
Nuclear binding energy |
||||||||||||||||||||||||||||||||||
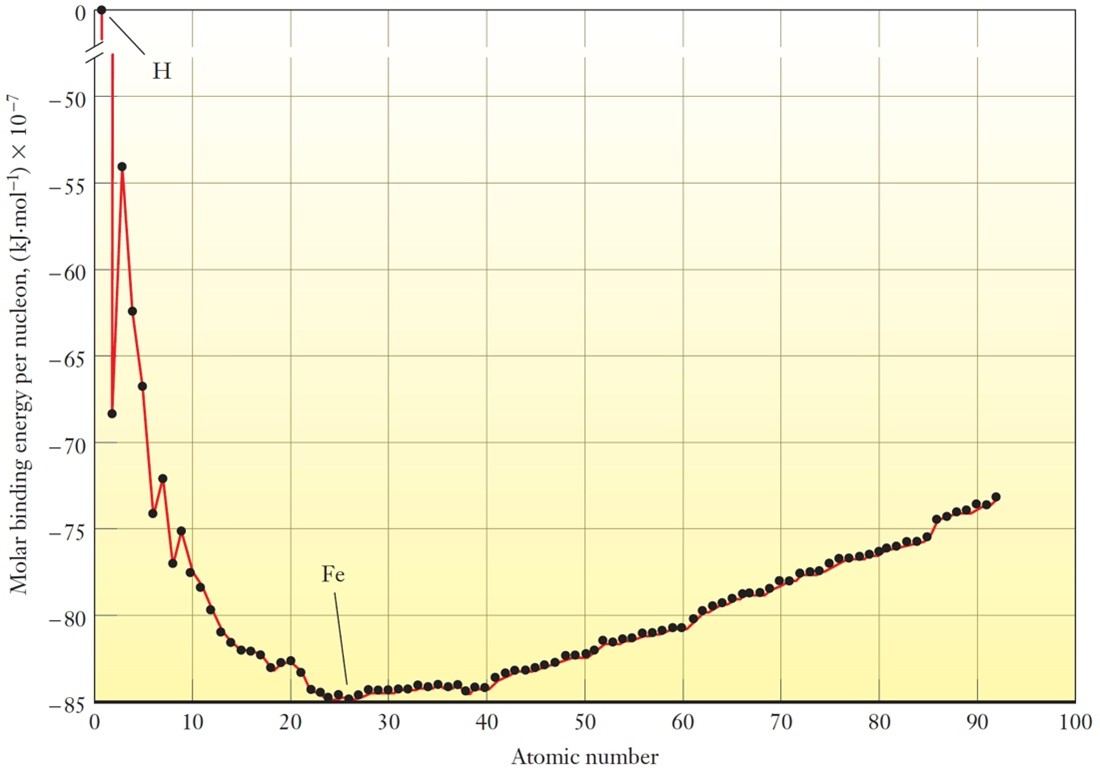
| In nuclear fusion, reactants come together to form products with a lower mass. In nuclear fission, nuclei break apart to form products with a lower mass. It may seem strange that both forming nuclei and breaking nuclei can release energy (via mass loss). The explanation lies in the nuclear binding energy, the energy released (via mass loss) when a nucleus is formed from its protons and neutrons, Figure 4. | ||||||||||||||||||||||||||||||||||
|
||||||||||||||||||||||||||||||||||
To compare binding energies among different elements, as in Figure 4, the energies are given per nucleon, nuclear particles (protons and neutrons). For example, when 10 protons, 1p+, and 10 neutrons, 1n0, combine to form a 20Ne10+ nucleus, the energy released is divided by 20 to get the binding energy per nucleon. The mass loss and binding energy when 20Ne10+, 19.992440 u, forms are: Δm = (19.992440 u) – 10 (1.007825 u) – 10 (1.0086649 u) The slightly odd exponential factor here (107) is used to compare with the energy axis in the figure where numerical values are given in units of 1 x 10⁷ kJ/mol·nucleon. You see that the value just calculated matches the value for neon, atomic number 10, in the figure. The nuclear binding energy curve explains why fusion is feasible for light nuclei, where the products will have more binding energy and hence be more stable than the reactants. Whereas, fusion would be an uphill battle for heavier nuclei, fission of very heavy nuclei yields more stable lower atomic number products. But why does it have this shape? The answer lies in the imbalance between an attractive and a repulsive force within the nucleus. The repulsive force inside nuclei is easy to understand from our experience with electrically charged particles—like charges repel. The protons in a nucleus repel one another and the more there are, the greater the net repulsion. The attractive force is called the strong nuclear force and has no analogy in our everyday experience. It is an interaction among protons and neutrons that binds them tightly together. The details of the force are not relevant to our qualitative discussion. The strong attractive force is always the most dominant; otherwise no nuclei would exist. However, at around atomic number 26, iron, the repulsive force begins to have a large enough effect to offset more of the strong force of attraction. At iron, nuclear stability is greatest (largest nuclear binding energy per nucleon) and grows less stable as more protons and neutrons are added. Nucleosynthesis in stars cannot create heavier nuclei, but require the cataclysmic energies and mix of fundamental particles of supernovae. |
||||||||||||||||||||||||||||||||||
Radioactive decay |
||||||||||||||||||||||||||||||||||
Most of this Activity focuses on the energy released and a product formed by the radioactive decay of K-40, with little emphasis on the decay of Th-232, U-235, and U-238 that also make large contributions to the Earth’s internal energy. These nuclei decay via three different complicated series of alpha and beta particle emissions and sequences of radioactive nuclei that ultimately each end at a different stable lead isotope. The net reactions are: 232Th90+→208Pb82+ + 6 4He2+ + 4 0e- |
||||||||||||||||||||||||||||||||||
A2.
|
How do the energies released by these net reactions compare to one another? Is this result consistent with the nuclear binding energy curve? What would be the expected results from the nuclear binding energy data in Figure 4? |
|||||||||||||||||||||||||||||||||
Appendix B. Moles of atmospheric gases |
||||||||||||||||||||||||||||||||||
You may already have gone through the logic and calculations to find the number of moles of gas in Earth’s atmosphere, but if not, work through the items here to get the result. The idea is to “weigh the atmosphere” via its barometric pressure, and convert the mass over the entire planet to the number of moles. Atmospheric pressure (at sea level) supports a 0.76-meter column of mercury in a mercury barometer. The column of air above the barometer tubing has a mass equal to the mass of the column of mercury in the tube. |
||||||||||||||||||||||||||||||||||
B1.
|
Imagine a barometer with a tube that has a cross-sectional area of one square meter, 1 m2. The mass of mercury (density = 13.5 x 10³ kg/m3) in this barometric column at sea level is equal to the mass (in kg) of air pressing down on each square meter of Earth’s surface. What is the mass of air above each square meter of Earth’s surface? |
|||||||||||||||||||||||||||||||||
B2.
|
The radius of the Earth is about 6.4 x 10⁶ m. Assume the planet is spherical and find its surface area. |
|||||||||||||||||||||||||||||||||
B3.
|
Calculate the total mass of Earth’s atmosphere. |
|||||||||||||||||||||||||||||||||
B4.
|
Earth’s atmosphere is about 78% N2, 21% O2, and 1% Ar, which gives an average molar mass of 29 g. How many moles of gas does the atmosphere contain? Explain the reasoning for your response.
|
|||||||||||||||||||||||||||||||||
| The graph below should be printed on an 8.5 x 11 sheet of paper. | ||||||||||||||||||||||||||||||||||
 |
||||||||||||||||||||||||||||||||||
 |
||||||||||||||||||||||||||||||||||
Instructor/presenter notes |
||||||||||||||||||||||||||||||||||
There are several threads and stories in this Activity and a presenter or instructor might pick and choose among them, depending on the audience and desired takeaway. Parts A and B are linked by the stories of K-40 and Ar-40, but the background emission focus of Part A is unnecessary in Part B, so the two parts need not be done together. Many people know about the concept of background radiation, but may not associate any radiation with themselves, so the calculation of their K-40 emission could be surprising and an engaging way to introduce the ubiquity of radioactive sources. Part B has two distinct stories: comparing the Earth’s internal energy production (largely radioactive decay) with energy arriving from the Sun to warm the surface and solving the puzzle of the origin of Earth’s atmospheric Ar-40 (since none is produced by stellar nucleosynthesis). A connection to climate science, for the comparison of internal to external energies, is to provide data one can use to respond to this argument, “There is so much energy coming from inside the planet that it must be responsible for global warming, not extra trapped energy from the sun-warmed surface.” This connection to climate turns out to be less than compelling for some audiences that say there is too much arithmetic for too little insight. It seems obvious to them that the interior of the planet isn’t going to undergo an abrupt change and cause a sudden warming. A different connection to climate science, through efforts to reduce carbon dioxide emissions, is made by comparing the energy available from inside the Earth to the energy used by humans. Since more is available from inside than all that is used by humans, it makes sense to ask how this internal energy can be tapped and what might stand in the way of its use. The major problem with using the internal energy is that it is highly dispersed and only available in large enough concentration at localized sites around the planet. But it is used in geothermal power plants and in a quite different way in ground source heat pumps for heating and cooling buildings without necessarily using carbon-emitting power sources. As there has been a great deal of K-40 decay since Earth was formed, it’s logical to think it is the source for the Ar-40 now present in the atmosphere. To show that this logic makes sense, the amount of Ar-40 that would have been produced is compared to the amount in the atmosphere (from Appendix B, if necessary). The comparison requires converting the total energy produced by K-40 decay, in watt-years, to the moles of K-40 decay and hence the moles of Ar-40 produced. This is done in a scaffolded series of stoichiometric conversions, the first of which introduces a technique that is useful in many applications where the areas under odd-shaped curves are desired. The technique requires the curves to be printed on paper, so they may be cut out and weighed to determine the relative areas from the ratios of the masses. If one area is known in units of the applicable variables, the others can be calculated from the mass ratios. (Before the advent and ubiquity of electronic integration, this was the technique extensively used to analyze the recorded output from instruments such as chromatographs.) |
||||||||||||||||||||||||||||||||||
These are the calculations and possible responses to the numbered items in the worksheet. |
||||||||||||||||||||||||||||||||||
Part A |
||||||||||||||||||||||||||||||||||
1. |
To get the number of K-40 nuclei in 140 g potassium (in a 70 kg person), find the mass of K-40 in the potassium, convert to moles, and then to number of atoms (nuclei).
Our bodies produce the radiation from these decays, about 90% beta particles and 10% gamma rays, throughout our lives. This radiation simply adds to the background we are bathed in from the surrounding environment without noticeable harm, because these natural levels are very low. |
|||||||||||||||||||||||||||||||||
2. |
Of the 1.8 x 10²⁰ atmospheric moles, 1.7 x 10¹⁸ mol |
|||||||||||||||||||||||||||||||||
Part B |
||||||||||||||||||||||||||||||||||
3. |
Figure 3 shows that about 25 TW of radiogenic energy is available from the Earth’s mantle. (Take care to be clear that watts are a unit of power, the rate at which energy is produced or used, not directly energy. Time must be accounted for to get energy.) If this is half the total thermal energy available from inside, the total must be about 50 TW. This is the energy source we want to compare with the Earth’s energy increase over the past 50 years. Although the energy from the interior decreases with time, over a short period the change is negligible and we can assume that 50 TW characterizes the last 50 years. (a) seconds in 50 yr (b) energy from interior = (50 x 1012 W)(1.6 x 10⁹ s) = 8.0 x 10²² W·s (c) There has been only about one-quarter as much energy coming from the Earth’s interior as has been added to the planet’s water, land, and air (from greenhouse gas warming) in the past 50 years. (d) Energy from the interior cannot explain the global warming we are experiencing. It is also unreasonable that energy from the interior should suddenly have such an effect, when it has been slowly reaching the surface for billions of years and is just part of the minor background compared to energy from the sun. |
|||||||||||||||||||||||||||||||||
4. |
Although energy entering the climate system from inside the Earth has a negligible effect on the climate, it is an enormous amount (about 50 TW)—more than double the total amount produced annually by all human activity (19 TW). However, the energy is widely dispersed under the entire surface of the planet (70% of which is covered by oceans), so it is difficult to tap into for human use; but not impossible. |
|||||||||||||||||||||||||||||||||
As mentioned above, there are “hot spots” of geothermal activity scattered around the planet. If steam or high-pressure hot water is associated with one of these, it can be harnessed to turn a turbine and generate electricity and/or used to heat buildings. The required steam is produced by the Earth’s natural radioactive decay energy rather than burning fossil fuels. At present, Iceland, situated over a rift between tectonic plates, is the iconic example of geothermal energy use with about one-quarter of its electricity generated geothermally (almost all the rest hydroelectric) and about ninety percent of its buildings heated with geothermal steam and hot water. Naturally occurring hot springs for geothermal energy are sparse, but human ingenuity has increased the availability of geothermal power by creating artificial hot springs, as represented by the simplified diagram in Figure 5. At appropriate locations, where the crust is relatively thin, deep wells are drilled into layers of water-permeable rock heated by radioactive decay in the underlying magma. Even if water is not initially present, it can be injected in one or more wells, label (5) in Figure 5, and the superheated hot water collected via other wells (1). When it reaches the surface, the high-pressure hot water is expanded rapidly in an evaporator (2) and the resulting steam used to spin a turbine that, in turn, drives a generator (3) to produce electricity for transmission to where it is needed. The now-condensed steam, hot water, is cooled (4) and can be re-injected, creating a cyclic process. Since the ultimate source of energy for the process is radioactive nuclear decay, this is nuclear power without a fission reactor. |
||||||||||||||||||||||||||||||||||
|
||||||||||||||||||||||||||||||||||
As you see, geothermal power plants are not limited to naturally-occurring sources of steam or hot water from Earth’s interior. But their locations still depend on finding favorable geology where the wells do not have to be unfeasibly deep to get near the source of energy, the magma. The technology developed for large scale hydraulic fracturing (“fracking”) in the last half century has increased the depth and breadth of possibilities available for locating geothermal power plants. Another way to tap into geothermal energy on a more personal level, just about anywhere, is a ground source heat pump heating-cooling system illustrated in Figure 6. |
||||||||||||||||||||||||||||||||||
|
||||||||||||||||||||||||||||||||||
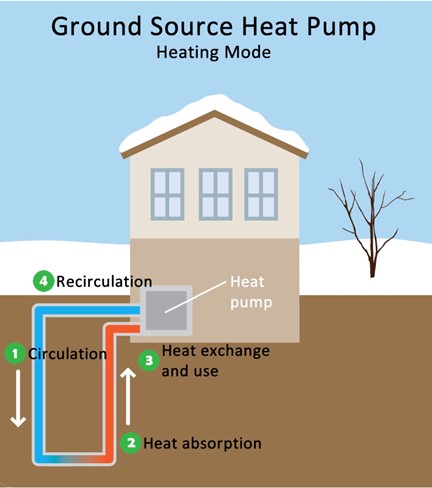
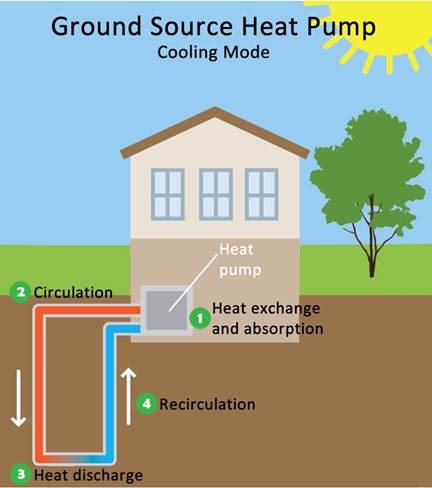
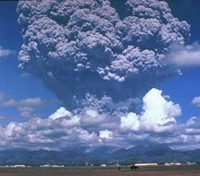
In a temperate climate, the temperature of a ground layer a few meters below the surface is pretty constant, as energy from the interior is conducted slowly toward the surface and the ground above the layer insulates it from surface changes. The temperature of the layer is intermediate between the high summer and low winter temperatures at the surface. The ground source heat pump system takes advantage of this situation as it pumps its working fluid (water, glycol, etc.) through the coils buried in this layer. Above ground, in the winter (left hand diagram), the working fluid cools (shown as blue) as it goes through the heat exchanger and gives up its energy that then warms the house. As the cooled fluid flows through the ground coils, it is warmed (shown in red) by energy from the surrounding higher temperature environment. Upon return to the heat exchanger, the energy is released to warm the house, as the cycle continues. In the summer (right hand diagram), the process is reversed and the heat exchanger in the house becomes the energy source, warming the working fluid and cooling the house, and the ground becomes the energy sink, removing energy from the warmed fluid. Ground source heat pumps are quite efficient, simple, and safe. If the electric power to run the pump motor is produced by carbon-free energy sources, a heat pump is a heating-cooling system with no carbon dioxide emissions. There is a “secondary” effect of the interior energy on climate. The interior energy drives volcanic eruptions, Figure 7, great bursts of material that can spew large amounts of sulfur dioxide into the stratosphere where it can be oxidized and ultimately form tiny droplets (aerosols) of sulfuric acid. These aerosols, as well as the particulate matter ejected by the volcano, generally reflect sunlight away from the Earth, so less reaches the surface and the planet cools. |
||||||||||||||||||||||||||||||||||
|
||||||||||||||||||||||||||||||||||
For a very large eruption, like Mount Pinatubo, the cooling effect may be felt for two or three years, until the aerosols finally precipitate out of the atmosphere. Although the surface temperature of the Earth has been inexorably increasing over the past couple centuries, tiny downward blips in temperature are obvious in the record for two or three years after a large volcanic eruption, until the air clears. (The lava flows from the slopes of some volcanoes, like the Kilauea volcano in Figure 2, are not “explosive” and do not spew sulfur dioxide and particulates high into the atmosphere, so do not have this cooling effect on the climate.) |
||||||||||||||||||||||||||||||||||
5.
|
Print enough copies of the graph at the end of Appendix B on 8.5 x 11 stationery, so each student group can carefully cut out the shapes and weigh them to the nearest hundredth of a gram. A sample set of data is 0.42 g for the rectangle and 0.75 g for the area under the K-40 curve. |
|||||||||||||||||||||||||||||||||
6.
|
time side of rectangle area K-40, W·s = 1.8(1.4 x 1030 W·s) = 2.5 x 1030 W·s = 2.5 x 1030 J |
|||||||||||||||||||||||||||||||||
7.
|
The average energy of K-40 decay is 0.9(1.211 x 10⁶ eV) + 0.1(1.505 x 10⁶ eV) = 1.24 x 10⁶ eV If a mole of K-40 nuclei decays, the number of joules released is |
|||||||||||||||||||||||||||||||||
8.
|
Dividing the total energy released by K-40 decays since the Earth formed by the energy released by one mole of decays gives the number of moles decayed. One-tenth of these decays produce Ar-40, so about 2.1 x 10¹⁸ mol Ar-40 have been formed. The result in item 2 shows that the atmosphere contains 1.7 x 10¹⁸ mol Ar-40. This is about 81% the total amount that has probably been produced by K-40 decay during the Earth’s lifetime. Since the lion’s share of the K-40 decays take place in solid (or viscous liquid) minerals deep below the Earth’s surface, it is not surprising that not all of it has managed to escape to enter the atmosphere. In fact, one of the methods used to date solid minerals that solidified millions to billions of years ago is to measure the ratio of Ar-40 to K-40 they contain. Assuming that any previously formed Ar-40 had escaped before solidification occurred, the Ar-40 present now was formed and trapped since the mineral solidified. |
|||||||||||||||||||||||||||||||||
The result of this Activity demonstrates how the properties of our planet evolve over time. Beginning 4.5 billion years ago with essentially zero argon-40, the Earth now has an atmosphere that is almost one percent argon-40. The atmosphere probably came to its present 21% oxygen content (prompting evolution of multi-cellular organisms) about one billion years ago. Natural changes occurring over tens of thousands, millions, or billions of years shape the climate. The results of human activities have accelerated the changes to decades and centuries. |
||||||||||||||||||||||||||||||||||
Appendix A |
||||||||||||||||||||||||||||||||||
A1. |
The other two nuclear reactions shown in the Figure 1 chain reaction diagram are: 235U92+ + 1n0 → 90Sr38+ +. 143Xe54+ + 3 1n0 Masses of 235U92+ and 1n0 from the worksheet Appendix and others from the internet (all rounded to five decimal places, which is sufficient for these calculations) are:
Δm (1st rxn) = (89.90774 u) + (142.93511 u) +2•(1.00866 u) – (235.04393 u) ΔE = (–1.8376 x 10⁻⁴ kg/mol)(3.00 x 108 m/s)2 = –16.5 x 10¹² J/mol Δm (2nd rxn) = (88.91228 u) + (143.93208 u) +2•(1.00866 u) – (235.04393 u) ΔE = (–1.8225 x 10⁻⁴ kg/mol)(3.00 x 108 m/s)2 = –16.4 x 10¹² J/mol The nuclear fission reaction energy calculated in worksheet Appendix A for the other reaction was –16.7 x 10¹² J/mol, so all three U-235 fission reactions yield essentially the same energy. |
|||||||||||||||||||||||||||||||||
A2. |
These are the net radioactive nuclear decays to be compared: 232Th90+ → 208Pb82+ + 6 4He2+ + 4 0e- The masses of the particles are:
Δm (Th-232) = (207.97665 u) + 6•(4.00260 u) + 4•(0.00055 u) – (232.03806 u) ΔE = (–4.361 x 10⁻⁵ kg/mol)(3.00 x 108 m/s)2 = –3.92 x 10¹² J/mol Δm (U-235) = (206.97590 u) + 7•(4.00260 u) + 4•(0.00055 u) – (235.04393 u) ΔE = (–4.763 x 10⁻⁵ kg/mol)(3.00 x 108 m/s)2 = –4.29 x 10¹² J/mol = –4.29 x 10⁹ kJ/mol Δm (U-238) = (205.97447 u) + 8•(4.00260 u) + 6•(0.00055 u) – (238.05079 u) ΔE = (–5.222 x 10⁻⁵ kg/mol)(3.00 x 108 m/s)2 = –4.70 x 10¹² J/mol = –4.70 x 10⁹ kJ/mol The nuclear binding curve, Figure 4, shows that the product lead nuclei in these reactions are more stable than the reactant nuclei, so a release of energy is expected. A complicating factor is the production of several alpha particles, helium-4 nuclei, that are less stable (per nucleon) than the lead nuclei. Since most of the mass of the products is in the lead nuclei, it’s likely that their contribution outweighs the alphas, but it is best to check. Consider the middle case of U-235 decaying to Pb-307. The binding energy graph is relatively small scale, so we can’t expect to get very accurate values for the calculation, but hope to be in the ballpark. The binding energies per nucleon are: U-235 –73.5 x 10⁷ kJ/mol·nucleon For the sake of space in writing the ΔE equation, the units will be omitted. The unit for values before the parentheses is number of nucleons with the binding energy within the parentheses. (Seven He-4 have a total of 28 nucleons.) ΔE = 207•(–76.0 x 10⁷) + 28•(–68.5 x 10⁷) – 235•(–73.5 x 10⁷) This energy change is the same as that calculated from the mass change. (Given the fairly rough estimates of binding energies from the graph, such close agreement is probably a bit fortuitous, since it is the small difference between two large values. Still, it is good to find that the values from two different ways of looking at the energy released by mass loss match one another.) |
|||||||||||||||||||||||||||||||||
Appendix B |
||||||||||||||||||||||||||||||||||
B1.
|
The mass of atmosphere pressing down on each square meter of the surface (at sea level) is equal to the mass of the 0.76 m column of mercury contained in the 1 m2 cross-section barometer tube: atm mass/m2 surface = (1 m2)( 0.76 m)( 13.5 x 10³ kg/m3) |
|||||||||||||||||||||||||||||||||
B2.
|
The surface area, A, of a sphere of radius r, is A = 4πr2. surface area of Earth = 4π(6.4 x 10⁶ m)2 = 5.1 x 10¹⁴ m2 This is a good number to remember, as it comes up many times in discussions of the climate and climate change. |
|||||||||||||||||||||||||||||||||
B3.
|
The total mass of the Earth’s atmosphere is the mass pressing down on each square meter, from B1, times the total area, from B2. atm mass = (10.3 x 10³ kg/m2)( 5.1 x 10¹⁴ m2) = 5.3 x 10¹⁸ kg This mass is a bit more than 5 million gigatonnes, where a gigatonne is a billion tonnes and a tonne is 1000 kg. These are the sort of mass units often used in discussing climate, climate change, and emissions of gases to the atmosphere. |
|||||||||||||||||||||||||||||||||
B4.
|
The total mass of the atmosphere (in grams) divided by the average molar mass of the gas gives the number of moles of gas. |
|||||||||||||||||||||||||||||||||
|
||||||||||||||||||||||||||||||||||
To obtain a Word file of this Activity, please fill out this brief form to help us track what is happening to our Workbook. We also encourage you to get in touch if you have an activity or idea for an activity that might add to the Workbook. We want to make this an alive and active document. |
||||||||||||||||||||||||||||||||||
 |