Light energy: absorption, emission, and planetary temperature
|
Light energy: absorption, emission, and planetary temperature |
Background |
||||
The objective of this series of activities and calculations is to examine what happens to the energy an object acquires when it absorbs light, including how it is released by re-emission at a wavelength that is usually different than the incident light. To begin, we will focus on wavelengths in the visible range, since these are easy to observe and their effects are often also easily seen. Then we will go on to consider infrared light, which is not visible, but that we can sense as “heat” (that allows you, for example, to locate a warm radiator in a dark room). |
||||
A. Sunlight and surfaces |
||||
The Sun is the source of almost all the energy humans use on Earth. The energy in sunlight is easy to observe/feel. On a bright sunny day, the air temperature is essentially the same in the shade and in the sunlight, but you feel a lot warmer in the direct sunlight than in the shade. Is the effect of sunlight the same on all surfaces? Work in groups to design and carry out an investigation to answer this question and determine what property or properties of the surface (if any) make(s) a difference and the direction of any difference. Cooperation among groups is encouraged. After the investigations have been set up, go on to further parts of the Activity and return later to discuss and analyze your results. |
||||
|
||||
| Analysis | ||||
Give a brief presentation, for the other groups, outlining the logic of your investigation, your results, and your evidence-based conclusions. (Poster paper and markers are available, as an option, to prepare a visual presentation.) Are the results from all groups basically the same, or are there differences? What could explain any differences? How might the explanation(s) be tested? |
||||
B. Is all light created equal? |
||||
| White light, like sunlight or the light in our usual living spaces, contains the colors of light from red to violet that we can see. Recall the mnemonic, ROY G. BIV (= red, orange, yellow, green, blue, indigo, violet) that helps one remember the range of colors in the visible spectrum (and rainbows). | ||||
From our everyday observation, we know the Earth’s atmosphere is transparent to the visible wavelengths that make up white light (from red, 700 nm, to violet, 400 nm). And we also know that radiation from the sun has many effects when absorbed by objects on Earth, including us. We feel warmer when standing in sunlight than when we stand in the shade. If we stay in the Sun long enough, we can get suntanned (or burned), so sunlight causes some change in the skin. We know that plants need sunlight to grow and thrive. All these processes—warming, tanning, growing, and many more—require energy supplied by light from the Sun. Here, we investigate different colors of visible light to find out how, if at all, the energy depends on the wavelength (color) of the light. |
||||
|
||||
| Procedure and observations | ||||
Before beginning the investigation, make sure the phosphorescent sheets have been in the dark long enough for any residual phosphorescence to decay. (This usually takes only a few minutes, but can be longer, depending on the phosphorescent material used for the sheets.) |
||||
1.
|
In a darkened room, remove a phosphorescent sheet from its light protection. Choose one of the LED penlights and flash it at a spot on the sheet for 1-2 seconds. Describe in as much detail as possible what you observe. What color was the LED light? Was a glowing light spot left on the phosphorescent sheet? If so, what color was the spot? Was it bright or dim? About how long did it last? (It’s often useful not to look at the LED flash, which can overwhelm your retina for a moment. Look at the sheet only after the light is off.) Repeat as often as necessary to be sure of your observations (allowing any glow from a sheet to disappear before using it again). |
|||
2.
|
Repeat this procedure with the other colors of LED penlights available. |
|||
3.
|
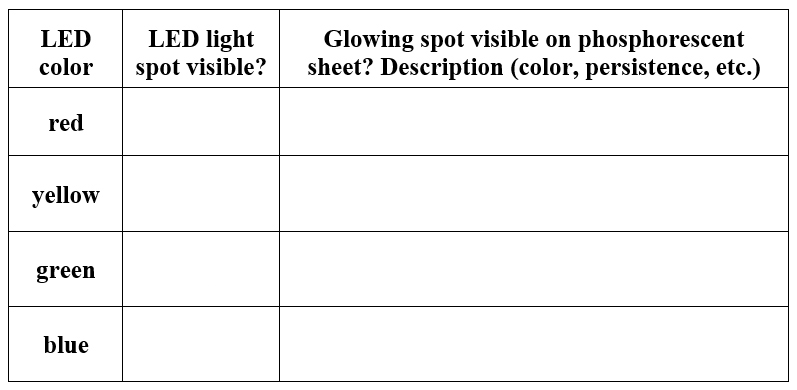
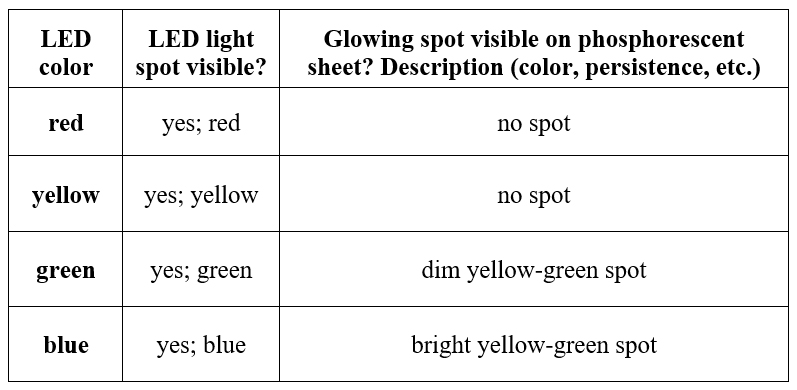
With the light back on, record your observations in a table like this.
|
|||
Analysis |
||||
4.
|
Do all the colors that make up visible light have the same effect on the phosphorescent sheet? What is the evidence for your answer? |
|||
5.
|
Is there a relationship between the color(s) of the visible spots on the phosphorescent sheets and the colors of the lights that create them? Describe the relationship. |
|||
6.
|
Assume that a phosphorescent sheet has to absorb some minimum amount of energy, in order to produce its phosphorescence. Does this model explain your observations and your responses above? Clearly explain the evidence for how and why it does or does not. |
|||
7.
|
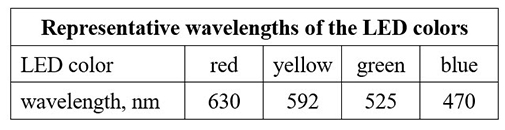
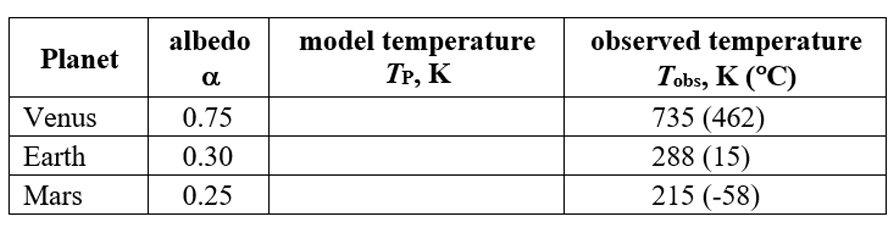
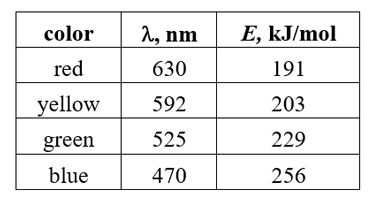
LED lights emit a (relatively narrow) range of wavelengths. The wavelengths in this table are representative values for the color range of the lights used here.
Describe the relationship between the wavelength and energy of electromagnetic radiation (light). Explain the evidence for your response. |
|||
8.
|
Imagine you have orange and violet LEDs. What would you expect to observe, if each was flashed on one of the phosphorescent sheets (emission color, brightness, duration, etc.)? See Appendix A for a more quantitative energy analysis. |
|||
C: Does the effect of light depend on distance from its source? |
||||
In your group, using an LED penlight and phosphorescent sheet(s), design an experiment to answer the above question, where the effect is phosphorescence emission. |
||||
9.
|
Clearly describe your experiment, how it was designed to answer the question, and the observations you made. |
|||
10.
|
What conclusion(s) do your observations lead to? Clearly explain the evidence for your conclusion(s) and your answer to the question. |
|||
11.
|
Does the amount of light emitted by the LED change with distance from the sheet? Clearly explain (perhaps with a sketch or diagram—use available poster paper and markers) how your answer to this question is consistent with your experimental conclusion.
|
|||
D: Energy from sunlight; energy conservation |
||||
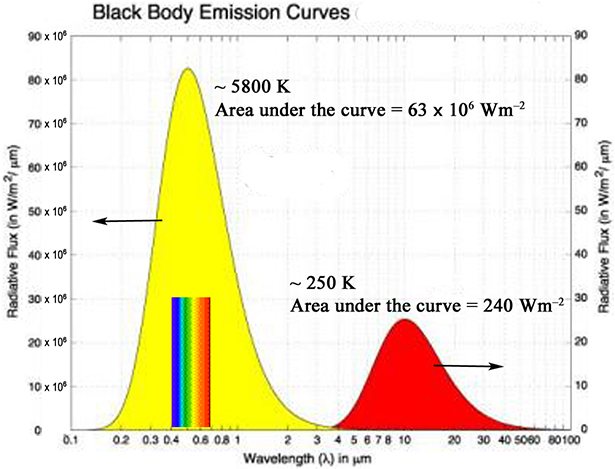
All objects at temperatures above absolute zero emit electromagnetic radiation (“light”) that can often be characterized as black body emission. (See below.) The wavelengths they emit depend on their temperatures. The higher the temperature, the shorter the wavelengths of emitted light. The yellow (left-hand) curve in Figure 1 shows the distribution of light energy from a surface at the temperature of the Sun, about 5800 K. The red (right-hand) curve shows the light energy emitted from an object at about 250 K, similar to the temperature of the Earth. |
||||
|
||||
The energy of these emissions, both visible and invisible, is probably qualitatively familiar. You can feel the infrared electromagnetic radiation (“heat”) emitted by an iron frying pan heated on the stove, but there is no visible emission. Heated in a blacksmith’s forge, an iron object will begin to glow a dull red and as the temperature gets higher will glow brighter and emit light that gets whiter and whiter (white heat). The tungsten filaments in incandescent light bulbs (if you remember these) are raised by electrical resistance to temperatures high enough to emit visible white light. (For comparison of the visible light represented by the spectrum in Figure 1 with the wavelengths of the LED lights used in Parts B and C, the wavelength units are related as 1 µm = 1000 nm.) Motions of the atoms and electrons in an object are the source of this energy that is emitted from its surface. Nineteenth century scientists studied the energy emitted by black bodies. The model of a black body is an oven (a heated cavity) with a tiny hole in the wall from which radiation leaving the interior is measured. The result of these studies is the Stefan-Boltzmann radiation law for the emission of energy from surfaces: S = σT4, where S is the energy emitted by the surface in W/m2 (W = watt; 1 watt = 1 J/s), T is the kelvin temperature, and σ (Greek lower-case sigma) is the Stefan-Boltzmann constant, 5.67 x 10⁻⁸ W/m2·K4. (Note the sequence of integers—5,6,7,8—that can help you remember this constant.) In our climate system, we are interested in the energy of the sunlight that bathes the Earth (and other planets and objects in our solar system). Although much hotter on the inside, we can closely approximate the surface of the Sun, from which its emission occurs, as a black body at a temperature of about 5800 K. |
||||
12.
|
Calculate the energy flux, SS, emitted by the Sun’s surface per square meter. SS |
|||
13.
|
If the radius of the Sun is rS, use SS and rS to write an expression for the total energy emitted by the Sun. total energy emitted by Sun = |
|||
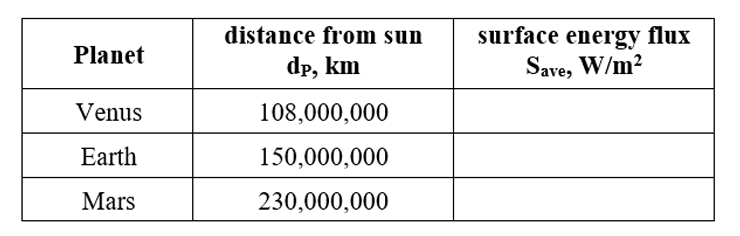
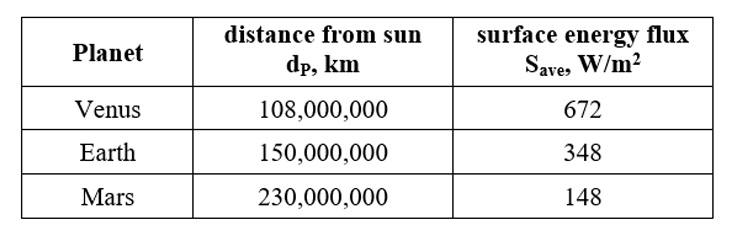
When the energy emitted by the Sun reaches the orbit of a planet, the large spherical surface over which the energy is spread has a radius, dP, equal to the distance from the Sun to the planet. The energy flux at any place on this surface, SP, is less than what it was at the Sun’s surface. (How is this related, if at all, to your results from Part C?) But the total energy spread over this large surface is the same as the total energy that left the Sun. |
||||
14.
|
Write an equation (as a function of the fluxes SS and SP) equating the total energy that leaves the Sun to the total energy spread over the spherical surface area at the planetary distance. |
|||
15.
|
Solve the equation you have just written for the energy flux at the planetary distance. SP = |
|||
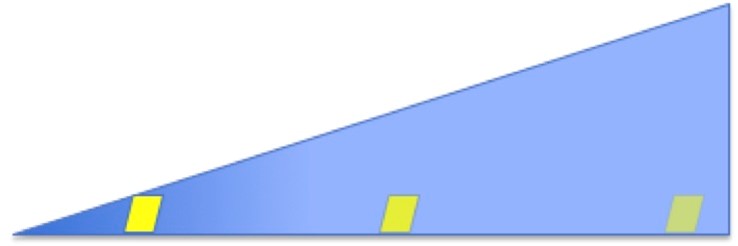
When radiation from the Sun reaches a planet, it does not strike all areas of the planet at the same angle (and the night side is not lit at all). It strikes directly near the equator, but more obliquely near the poles. (Are the Earth’s weather and climate affected by this difference? If so, how and what is your evidence?) The total amount of radiation incident on the planet at any instant is equal to the amount the planet intercepts to cast the imaginary shadow shown in Figure 2. |
||||
|
||||
16.
|
Write an equation for the total energy striking the planet. |
|||
Although the total energy falling on the planet is not evenly distributed, we are often interested in the average energy flux over the whole planet, Save. That is, we imagine the total energy striking the planet distributed evenly over the entire surface. |
||||
17.
|
Write an equation equating the energy spread over the entire planetary surface, Save, to the total energy incident on the planet from item 16. |
|||
18.
|
Solve the equation you have just written for the average surface energy flux over the whole planet. Express the result using the variables SS, rS, and dP. Save = |
|||
19.
|
The radius of the Sun, rS, is about 700,000 km. Use the equation you have written in item 18 to complete this table. |
|||
E: Planetary temperatures, energy balance, and albedo |
||||
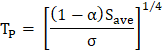
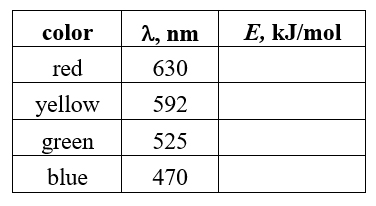
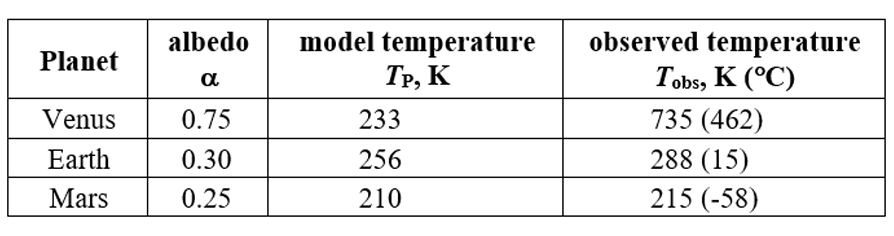
The temperature of a planet is determined by the balance between the amount of energy it absorbs from sunlight and amount of energy it loses back into space. To a good approximation, a planet acts (like many warm objects) as a black body and radiates electromagnetic energy, with its total energy emission given by the Stefan-Boltzmann equation (Part D). As we have also seen, in Figure 1, the wavelengths or frequencies of the electromagnetic radiation emitted by a black body are also temperature-dependent. Results for black body emission, like those in Figure 1, were a disaster for 19th century scientists. The electromagnetic radiation theory that worked for many other phenomena could not explain black body emission. The breakthrough came at the beginning of the 20th century when Max Planck proposed the radical model that the energy of light is a function of its frequency and comes in discrete packets. (See Appendix A.) A bright beam of light may contain lots of packets and have a lot of total energy, but each packet contains only a certain amount of energy. Using this model, Planck derived an equation that describes the observed emission of a black body as a function of its temperature. The curves in Figure 1 are calculated from this equation for a body at about 5800 K (temperature of the Sun) and another at about 250 K (temperature of a planet like the Earth). For a planet to maintain an essentially constant average temperature, the energy it emits has to equal the energy it absorbs. In Part D, you calculated the average sunlight energy flux, Save, reaching Venus, Earth, and Mars. However, depending on the surfaces the light falls on, some of it may be reflected back into space and less absorbed and converted to thermal energy. For a planet, the fraction of sunlight that is reflected away is called its albedo (from Latin meaning “whiteness”), symbolized α (Greek lower-case alpha). The actual amount of energy absorbed by the planet is reduced to (1 – α)Save. Assuming planets are in energy balance with the Sun and act as black bodies, the Stefan-Boltzmann equation can be used to equate their black body emission to the average sunlight input (accounting for their albedo). σTP4 = (1 – α)Save Here TP is the average planetary temperature, which is easily calculated from this model. |
||||
20.
|
Complete this table. |
|||
21.
|
How do the model and observed temperatures compare? What might account for differences (if any)? What if there was no albedo? |
|||
Appendix A |
||||
In the previous discussions, electromagnetic radiation (light) has been described in terms of the wavelengths of the radiation. In Part B, the colors and wavelengths of visible light were shown to be associated with the energies of the radiation, with longer wavelengths having lower energy. The concept of “color” even gets carried on to unseen invisible radiation for infrared (infra = lower) and ultraviolet (ultra = higher), where the prefixes denote, respectively, lower and higher energy than the color they modify. The inverse relationship between wavelength and energy can be a bit confusing, so we often use another wave characteristic, its frequency (number of times per second the wave oscillates), usually labeled ν (Greek lower-case nu). Frequency and wavelength, λ (Greek lower-case lambda), for a wave are related through the speed the wave is traveling (the speed of light is usually labeled c): Since there is an inverse relationship between wavelength and energy, this equation shows that frequency is directly related to the energy of the light. What is the relationship? At the beginning of the 20th century, Max Planck postulated a relationship between energy and the frequency of light that enabled him to explain the observed emission from black bodies. The relationship (expressed in frequency or wavelength) is Here E is the energy of light with a frequency ν (corresponding to a wavelength λ, as well as the color of the light), c is the speed of light (3.00 x 10⁸ m/s), and h is a constant, now called Planck’s constant, 6.67 x 10⁻³⁴ J·s. The hypothesis was controversial, but, within a short time, Einstein used the relationship to explain the photoelectric effect in which some frequencies of light could eject electrons from metal surfaces. Since the relationship could be used to explain two totally unrelated results, it was more readily accepted as a fundamental physical relationship. |
||||
22.
|
Use the Planck relationship to calculate the energies of the wavelengths of the penlights used in this activity to activate a phosphorescent sheet. The energy given by the Planck relationship is the energy for a single “particle” of light (a photon). To get the energy of a mole of photons, the single photon energy has to be multiplied by Avogadro’s number, 6.02 x 10²³ particles/mol. Energies of the light sources |
|||
23.
|
How are these energies related to the observations you recorded and the pattern(s) you see in the results for excitation of a phosphorescent sheet? Explain your reasoning. |
|||
 |
||||
Instructor/presenter notes |
||||
These are the anticipated observations and suggested reasoning for the numbered questions. |
||||
| Part A | ||||
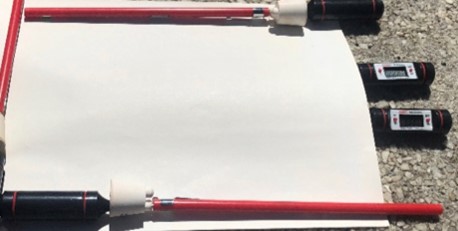
When Part A wraps up, one or two groups (not everyone, as that would be boring and surely repetitive) should present their procedure, results, and conclusions. The simplest, most straightforward, set-up is likely to be similar to that in the photograph in Figure 3. Only the white construction paper is shown, but black is treated the same way. This experiment was done outdoors in the sunshine, so the papers are weighted down on the edges to prevent being blown away, if there is a breeze. (Tape is provided in the materials to secure your papers, if necessary.) Two thermometers are shown in this experiment (designed to see how consistent the data might be). One is sufficient and available in the materials for each color paper in this activity. |
||||
|
||||
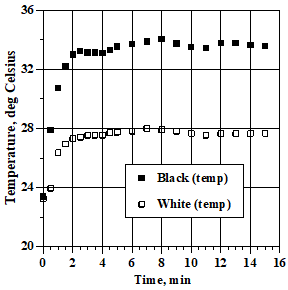
Data for the experiment shown in the photograph are plotted here (average of the temperatures from the two thermometers under each sheet of paper). Time is the time the papers were in the sunlight. When the temperatures become reasonably constant, the temperature under the black sheet is about 6 °C warmer than under the white sheet. This evidence allows us to conclude that the black surface absorbs more energy, gets warmer than the white, and is better at warming whatever it contacts. This information informs Part E, the need to include albedo in calculating predicted planetary temperatures from their solar energy balance. The results from Part A should be invoked when discussing albedo in Part E. |
||||
| Part B | ||||
A note on materials: Phosphorescent vinyl sheet and LED lights in several colors are available from Educational Innovations as well as other suppliers. The penlights are available from Photon, their manufacturer (Photon Micro-Light II LED Keychain Flashlight). |
||||
1/2.
|
The colors of all the LED penlights are visible at the light source itself and the light reflected from the vinyl sheet. The red and yellow lights leave no glowing spot on the phosphorescent sheet. The green light leaves a glowing dim spot of yellowish green (or greenish yellow) light emitted by the sheet. This emission fades quickly with time until the sheet is dark once again (usually within less than a minute). The blue light leaves a glowing bright spot of yellowish green light emitted by the sheet. This emission fades with time (but lasts longer than the dim glow from the green LED excitation) until the sheet is dark once again. |
|||
3.
|
Experimental observations of the effects of the light sources: |
|||
4.
|
Not all colors of visible light have the same effect on the phosphorescent sheet. When red and yellow penlights are used, the colors of the light beams, red and yellow are reflected from the sheet, but there is no visible emission from the sheet. The beam from the green penlight is reflected from the sheet and there is a dim yellow-green emission from the sheet that disappears almost immediately. The emission is so dim and short-lived that it is often difficult for an audience to observe from a distance, although it is detectable close up. The light from a blue penlight is reflected by the sheet and leaves behind a bright spot of the yellow-green emission that takes longer to fade than the glow from the green LED excitation. |
|||
5.
|
Using the ROY G. BIV characterization of the progression of the colors of the visible spectrum, we see that the red and yellow penlights produce no emission from the phosphorescent sheet, while the green and blue penlights produce increasingly intense (and longer-lasting) emissions. Thus, there is zero emission from light at the red end of the spectrum and increasing emissions at the blue-violet end of the spectrum. The visible emissions from the phosphorescent sheet are all the same color, yellow-green, regardless of the color of the penlight that produced them. The emitted color is toward the Red end of the ROY G. BIV spectrum compared to the colors of the penlights that produce it. |
|||
6.
|
A model that assumes the phosphorescent sheet has to absorb some minimum amount of energy, in order to produce its phosphorescence, is consistent with the pattern from item 5, if we assume that the colors of light are associated with different energies. Some colors of light have enough energy to produce phosphorescent emission from the sheet and other colors do not. The observations show that light energy at the red end of the spectrum is not enough to produce phosphorescence, but light at the blue-violet end does have enough energy. Further the results suggest that this energy has to be greater than the energy of yellow-green light in order to produce the emission. The minimum energy required to excite phosphorescence is represented by the energy of the yellow-green emission. Colors toward the red end of the spectrum, relative to the yellow-green, have less than the minimum required energy. Colors toward the blue-violet have more than the minimum energy (and increasingly more as the colors get further from the yellow-green minimum). |
|||
7.
|
The analysis in item 6 suggests that the energy of light of different colors increases from red to violet across the visible spectrum. The data table shows that the wavelengths of visible light decrease across the spectrum. Thus, the energy of light (electromagnetic radiation) increases as the wavelength of the light decreases (an inverse relationship; see Appendix A). |
|||
8.
|
Since orange light is at a longer wavelength than yellow-green light, its energy is less and will not have enough energy to excite phosphorescence in the sheets. Violet light is at the extreme short wavelength end of the visible spectrum and has more than enough energy to excite the phosphorescence, which may be even more intense than that excited by the blue light. These predictions are easily tested (and prove to be true), if an orange and violet penlight are available. |
|||
| Part C | ||||
9.
|
Flashing the blue penlight on the phosphorescent sheet for the same amount of time at increasing distances from the sheet should be the essence of the experiments devised. The intensity and duration of the phosphorescence should decrease as the distance increases. It’s likely that the sheet will be more uniformly excited from a greater distance, but the intensity will be low. |
|||
10.
|
The emission intensity from the sheet decreases as the distance from the exciting light source increases. The answer to the question posed is that the effect of a light source depends on the distance from the source (effect decreases with distance). |
|||
11.
|
The penlight produces the same amount of light, no matter its distance from the sheet, so the decreasing effect must have something to do with what happens to the light after it leaves the source. The light starts in the small volume of the penlight bulb, but spreads out in all directions from the bulb. The amount of light that reaches the sheet is only a fraction of the amount that left the bulb—the rest has spread and misses the sheet, Figure 4. The farther the sheet is from the bulb, the larger the amount of the light that misses it and the smaller the fraction left to excite phosphorescence. Quantitative measurements show that light spreading from a point source (approximated by the small penlight bulb) decreases in intensity (at a detector like the phosphorescent sheet) by the inverse square of distance from the source. If I0 is the intensity of a point light source, the intensity, I, at a distance d away is proportional to I0/d2. |
|||
|
||||
Part D |
||||
12.
|
Surface energy flux from the Sun using the Stefan-Boltzmann radiation law: SS = (5.67 x 10⁻⁸ W/m2·K4)(5800 K)4 = 6.4 x 10⁷ W/m2 |
|||
13.
|
Total energy emitted by the Sun (watts) is the surface area of the Sun, 4π(rS)2, times SS total energy emitted by sun = 4π(rS)2SS |
|||
14.
|
At a planetary distance, dP, the total energy is the same as at the surface of the Sun, but spread over a much larger spherical surface. The flux at the planet surface is SP (in W/m2) and equating the total energies gives energy at the Sun = energy at planet distance = 4π(rS)2SS= 4π(dP)2SP |
|||
15.
|
Energy flux at the planet surface |
|||
16.
|
Total energy falling on the planet is the amount intercepted by the cross section of the planet (the shadow circle in the diagram) = πr2SP |
|||
17.
|
The average energy flux that falls on any part of the surface, Save (in W/m2), times the planet’s surface area is equal to the total energy from item 16 4πr2Save = πr2SP |
|||
18.
|
Solve the equation in item 17 for Save and express the result in terms of the variables SS, rS, and dP |
|||
19.
|
|
|||
| Part E | ||||
20.
|
Use the relationship |
|||
21.
|
In all cases, the modeled temperature is too low, disastrously so for Venus where the surface temperature is high enough to melt lead and space probes survive for only a very short time. Some other effect or effects must be at play and looking at the planetary atmospheres provides a clue. (The role of atmospheric gases in controlling planetary temperatures, the greenhouse effect, is explored in the Global warming and greenhouse effect background.) |
|||
| Appendix A | ||||
22.
|
These are the results for the Planck energy calculations. Note that only one of them needs to be calculated from the Planck relationship. The others can then be calculated by multiplying the resulting energy by the appropriate ratio of the wavelengths, which reduces the tedium of the calculations. Energies of the light sources |
|||
23.
|
Now we can be more quantitative about the energy available from the light in each light source and the energy required for the phosphorescence. The results indicate that at least 229 kJ/mol is required to produce emission, but 203 kJ/mol is not enough, so the required energy probably lies in this energy range. Since all the emissions from the sheet are the same color, the energy emitted is the same. Therefore, the emission process must always be from the same energy change in the phosphorescent sheet, no matter how much energy (above the threshold between 203 and 229 kJ/mol) is used to cause the emission. The information provided in the “phosphorescence mechanism” section below, allows a bit more detail to be drawn from the results of this relatively simple experiment and its analysis. |
|||
The emphasis in this activity is on the Planck relationship between the wavelength of (visible) light and the energy associated with this light. However, for classroom discussion, we should not forget what prompted Planck to postulate the energy-wavelength (frequency) relationship. He was trying to develop a model of the behavior of an energy source, a black body, and the wavelengths of light it emits. His explanation for observed black body radiation, a radical departure from the past model, was the beginning of the modern quantum theory of matter. This is often the only reference to black bodies that is made in introductory chemistry courses. A discussion of climate science that includes the energy balance of the Earth (visible light energy in and infrared light energy out) provides an avenue to make the properties of black bodies more immediate, interesting, and relevant. |
||||
| The phosphorescence mechanism | ||||
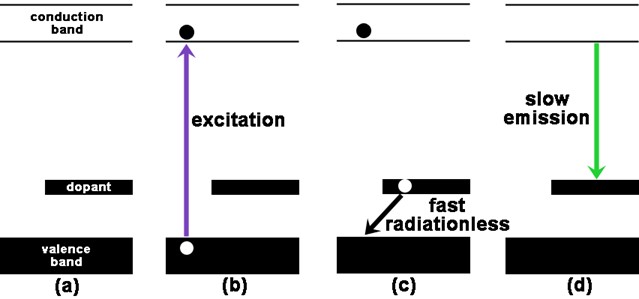
Electrons in the copper-doped zinc sulfide phosphorescent material used in this experiment must be excited to higher energy states in order to produce emission from the sheet. The processes going on are illustrated in the schematic energy level diagrams in Figure 5. |
||||
|
||||
The relative lengths of the arrows in Figure 5, diagrams (b) and (d), show that the excitation energy must be higher than the emission energy. The emission energy is always the difference in energy between the lowest level of the conduction band and the energy level of the dopant. This explains why the emission from the sheets is always the same yellow-green, no matter what the energy (color) of the exciting light. The photons from the red light do not provide enough energy to excite the electrons in these phosphorescent sheets. This makes sense. The emission from the sheets is yellow-green, so the emitted energy corresponds to this color, which is at a shorter (more energetic) wavelength than red light. The red light does not provide enough energy to excite the electrons. Blue light can and does provide the required energy, since it is at a shorter wavelength (higher energy) than the yellow-green emission. The semi-quantitative conclusion (from the energies you calculated in Appendix A) is that the required excitation energy lies somewhere between approximately 190 kJ/mol (red) and 255 kJ/mol (blue). This range is narrowed by using lights with other colors that lie between red and blue in the visible spectrum. Your data give an approximate range, 203 to 229 kJ/mol, for the energy required to excite phosphorescence in these sheets. The absorbance of this copper-doped zinc sulfide phosphorescent material begins in the green region of the visible spectrum (consistent with the green light excitation of the phosphorescence) and increases to a maximum in the near ultraviolet at about 365 nm. Since the absorption of light by the phosphor increases from green to blue, this range of colored lights produces increasing numbers of excited electrons. Thus, green light produces fewer excited electrons and the glow is dimmer and of shorter duration because few emitters are produced and take little time to be used up. Blue light produces more excited electrons and the glow is brighter and longer lasting because many emitters are produced and take more time to be used up. What do you predict would be observed with violet light? What is your reasoning? An extension of this experiment is to explore the activation energy for the emission, two sheets of the phosphorescent material can be excited by the same light source and then, in the dark, one warmed and the other cooled or held at room temperature while the time for the emission to decay is timed. Alternately, a sheet can be excited and then, in the dark, a portion of it gently warmed (or cooled) to observe any difference in emission from the warmed and non-warmed portions of the sheet. |
||||
| Connection to climate and climate change | ||||
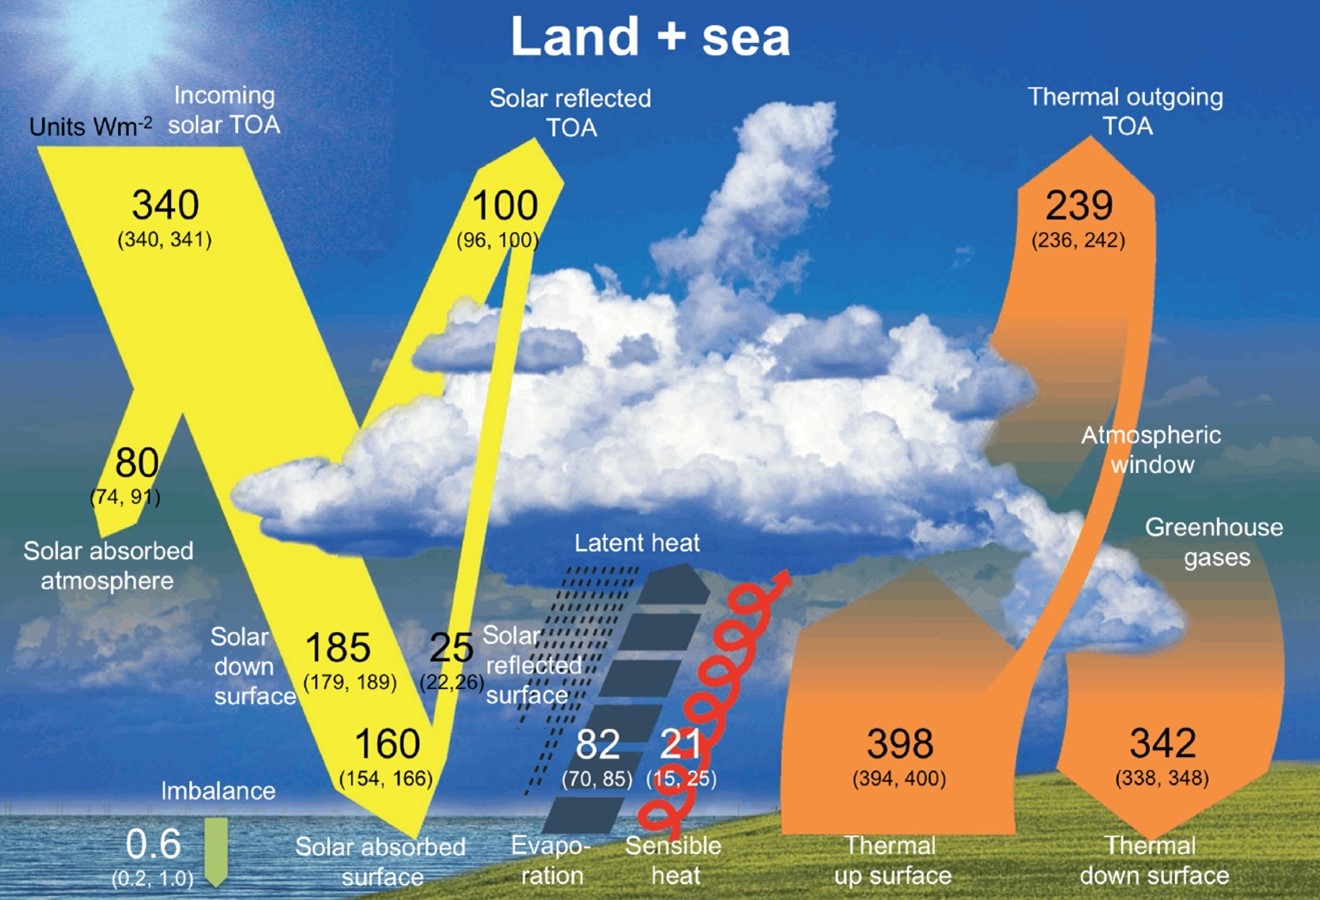
You can easily detect the energy in light. Absorption of light energy by the molecules in your skin increases their average energy and thus their temperature, so you feel warmer standing in sunlight compared to shade. Absorption of sunlight by molecules in the atmosphere and on the surface of the Earth, represented by the yellow arrows on the left-hand side of Figure 6, provides almost all the energy input to the planet. Also represented in the figure are transformations of the absorbed energy into molecular motions and other wavelengths of electromagnetic radiation that are the basis for our climate and weather. Long-term changes in the amount of energy retained (or lost) by the planet are observed as changes in the climate. The increasing average temperature of the Earth since the Industrial Revolution is an example of such a change. (See Heat capacity and fate of Earth’s energy imbalance) The way atmospheric gases, added by human activities, cause the “greenhouse effect” (represented by the orange arrows on the right-hand side of the figure) are responsible for this temperature increase as discussed in the Global warming and greenhouse effect background. |
||||
|
||||
In Parts B and C of this Activity, the emphasis was on the electromagnetic radiation (light) we can see (that produced by the pen lights and the emission from the phosphorescent sheet) and its energy. Other forms of energy were neglected. For example, the energy of the light from a blue LED is more than enough to excite an electron from the valence to the conduction band, so the electron is excited higher into the conduction band. To get to the lowest level of the conduction band, as illustrated in Figure 5, diagrams (b) and (c), the electron has to lose energy. This energy is lost by transfer from the electron to the motions (largely vibrations) of the molecules that make up the phosphorescent sheet. Increased molecular motion means higher average energy of the material, that is, higher temperature. The sheet gets a tiny bit warmer, but this is not detectable because the LED emissions are not very intense and the heat capacity of the sheets is large compared to the added energy. You might use this as an analogy to the large amount of Earth’s greenhouse warming that is taken up by the oceans (with a small increase in temperature) compared to the atmosphere. (See Heat Capacity and Fate of Earth’s energy imbalance) |
||||
References |
||||
1.
|
Part B of this activity is derived from Demonstration 12.38 and the Introduction, in Shakhashiri, B. Z., Schreiner, R., and Bell, J. A., Chemical Demonstrations, Volume 5: Color, Light, Vision, Perception, University of Wisconsin Press, Madison, WI, 2011, pages 235-237 and 47-48. |
|||
2.
|
A demonstration essentially identical to Part B was included in the presentation “Using LEDs to demonstrate properties of light and the interaction of light and matter,” Hershberger, A. S., Sarquis, A. M., and Hogue, L. M., The 19th Biennial Conference on Chemical Education, Program Booklet, The Division of Chemical Education of the American Chemical Society, Purdue University, 2006. |
|||
|
||||
To obtain a Word file of this Activity, please fill out this brief form to help us track what is happening to our Workbook. We also encourage you to get in touch if you have an activity or idea for an activity that might add to the Workbook. We want to make this an alive and active document. |
||||
 |