Osmosis
|
Osmosis |
A. Introduction to osmosis |
||||
Osmosis is relatively slow, so your time will be more efficiently spent, if your group sets up the activity before taking part in a class discussion of the process and then examines and analyzes the experimental results. |
||||
|
||||
| Procedure | ||||
Put water in one cup and salt solution in the other. Place the cups on a piece of paper labeled to identify the liquid in each cup. Test how firm each piece of vegetable is by gently trying to bend it. Place one piece in the water, another in the 20% salt solution, and set the third piece aside as a control. Set the paper and cups aside for about 30 minutes or so while you go on to discuss the following background information. |
||||
| Osmotic process | ||||
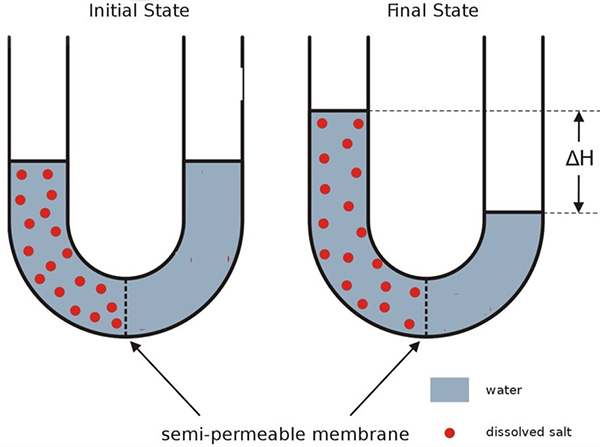
The word “osmosis” is derived from the Greek word for “push”. The process of osmosis is illustrated schematically in Figure 1, which shows that the osmotic process “pushes” water from one side of the semipermeable membrane to the other. The semipermeable membrane allows water molecules to pass through (is permeable to water), but does not allow nonvolatile solute molecules to pass through (is impermeable to ions or organic substances like sugars and proteins). Although semipermeable membranes for other solvents exist, the vast majority of osmotic processes on Earth involve aqueous solutions, so we focus on the solvent water. The movement of water is from the pure water side of the membrane to the solution side. |
||||
|
||||
A molecular level mechanism for the osmotic process is hard to quantify, because it depends on the molecular interactions in liquids, which are not easy to model. However, one factor that must be involved in determining the direction of solvent movement and the attainment of equilibrium is the entropy change associated with the dilution of the solute. The increase in entropy (a favorable change) as the solution is diluted is discussed in the Direction of change and entropy Activity, Part D. Besides the dilution of the solution, another obvious change that occurs during osmosis in the set-up of Figure 1 is the increase in height of the solution as water moves into the solution arm of the U-tube. Raising a mass of solution in the Earth’s gravitational field requires work, a form of energy. This energy has to come from somewhere and somewhere is the thermal surroundings that transfer heat to the contents of the U-tube. To account for these heat and work factors requires a deeper dive into thermodynamics than we wish to take for this Activity, which is mainly focused on the direction of the osmotic process. For now, we will reason on the basis of the entropy increase when water moves through a semipermeable membrane from a lower to a higher concentration solution (thus diluting the more concentrated solution). |
||||
B. Biological cells, cell membranes, and osmosis |
||||
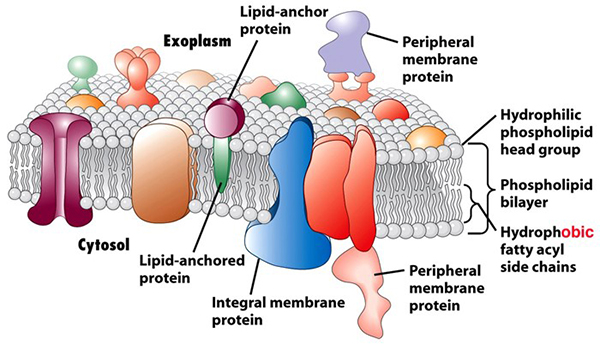
Living cells are essentially an aqueous mixture (cytosol) of hundreds of kinds of ions and molecules big and small contained inside a flexible phospholipid bilayer membrane, Figure 2. The phospholipid molecules that make up the membrane are illustrated by round balls (heads) with two long squiggles (tails or side chains) extending from each one. The head structures contain a negatively charged phosphate group that is attracted to and by water molecules, so the heads are called “hydrophilic” (water-loving). The tails are from long hydrocarbon chain carboxylic acids (called “fatty acids”, because they are the major components of fats and oils: lipids). These acids commonly contain 16 or 18 carbons with the first carbon in the chain being part of a carboxylate bonded to the head group. The long hydrocarbon chains are nonpolar and more attracted to one another than to water molecules, so they are called “hydrophobic” (water-fearing). The phosphate and fatty acids account for the name “phospholipid”. |
||||
|
||||
The phospholipid bilayer membranes of plant and animal cells bring the nonpolar fatty acid tails from the individual layers together between their polar heads. This bilayer arrangement shields the tails from interaction with water. The phospholipid bilayers are dotted with a large number of embedded proteins and other molecules that carry out numerous life-sustaining functions. The bilayer cell membranes are semi-permeable, that is, water molecules can slip through, but ions and other molecules generally pass through much more slowly. (Many of the membrane proteins are, in fact, necessary to facilitate and control the passage of these ions and molecules in and out of the cell.) Surrounding the membrane, plant cells also have a porous cell wall composed of polymers of amino acids and substituted sugar molecules. The wall maintains the shape of the plant (like the skeleton or exo-skeleton of animals). |
||||
This Activity takes advantage of the semi-permeable property of cell membranes to explore and analyze the osmotic process. |
||||
| Analysis | ||||
1.
|
Reasoning from what you have learned about entropy, what do you predict for the direction of flow of water through the membranes of your vegetable in pure water? What do you predict to observe about possible change in the firmness of the piece? Explain clearly. |
|||
2.
|
Reasoning from what you have learned about entropy, what do you predict for the direction of flow of water through the membranes of your vegetable in 20% NaCl solution? What do you predict to observe about possible change in the firmness of the piece? Explain clearly. |
|||
3.
|
After the vegetable pieces have been in the water and salt water for about 30 minutes, use a plastic spoon to remove them and pat them dry with a paper towel. Again, test how firm each piece is by gently trying to bend it and comparing it to the control. What are your observations? Are your predictions confirmed? Explain the evidence for your conclusions. |
|||
4.
|
Figure 1 shows that the osmotic process can raise a column of liquid against the force of gravity that pulls it down. That is, work is done as water moves from one side of the semipermeable membrane to the other. In this activity with the vegetable pieces, there is no obvious lifting of a liquid against the force of gravity. Is there any other evidence of a liquid being moved against a restraining force in this Activity? Clearly explain your response. |
|||
C. Reverse osmosis |
||||
5.
|
If the osmotic process in a system has come to equilibrium (as represented at the right in Figure 1), the “push” of solvent is the same on both sides of the membrane. What might you think about doing to reverse the process and move the system back toward its original state (represented at the left in Figure 1)? You are not asked to describe how you would amend the set up to bring about the reverse osmosis, but what the amendment(s) would need to be able to do. |
|||
 |
||||
Instructor/presenter notes |
||||
This Activity is meant to be done after students have been introduced to entropy and the idea that the entropy of a solution (homogeneous mixture) is generally higher than the entropy of the pure solvent. Such background could be provided by the Direction of change and entropy Activity. One suggestion is that this osmosis Activity be incorporated in the entropy Activity as an example of the use of the entropy principle; an appropriate place for that is included in the entropy Activity. The suggested worksheet for the Activity begins with groups setting up their vegetable in water and salt water. The osmotic process can then be going on while whatever discussion of the process you wish to include takes place. The notes here begin with the osmosis analysis of Part B, followed by Part A, discussion of the osmotic process and Part C, an introduction to reverse osmosis, which is the climate connection for this Activity. |
||||
| Part B | ||||
Any firm root vegetable (potato, turnip, carrot, etc.) is satisfactory for this activity. (The “baby” carrots available at the grocers and cut in two lengthwise are often ideal.) For a life science class or one with a connection to the life sciences, you might consider using more than one vegetable to show their common behavior and, hence, likely similar cellular structures. The pieces need to be thick enough to flex only a small amount before they are placed in the water and salt water. They need to flex a bit, in order that changes later are easy to judge. Another way that is often used to analyze the changes that occur is to weigh the pieces of vegetable before and after they are in the liquids. But the results may be ambiguous. The piece in salt water will lose an easily measurable mass, but the piece in pure water will gain only a small amount of mass (or none, if the balance is not sensitive enough). The problem is that the cells are quite full to begin with and it is difficult to force more water in, because the cell walls resist an increase in size. Thus the osmotic process reaches its limit (or becomes very slow) when only a little water has entered the vegetable piece. The difference in mass behavior of the two pieces can be confusing, so the flexibility measure, which is easily interpreted in terms of more or less filling of the cells is preferable. Although the osmotic process is more complicated, see below, the analysis in this part is based simply on the direction of spontaneity for mixing, as discussed in Part D of Direction of change and entropy. |
||||
1.
|
The contents of the plant cells are solutions of many kinds of molecules—a mixture with high entropy. When the cells are placed in a bath of pure water, water should pass through the membrane to increase the volume of the mixture and hence increase its entropy. Another way of looking at the process is that water passes spontaneously through a semi-permeable membrane from lower concentration of solute (zero in pure water) to higher concentration of solute (the mixture in the cells). If water enters the cells and increases their volume, the piece of vegetable should become stiffer (firmer), as the cells push harder against one another. |
|||
2.
|
The direction of water flow when cells are placed in the 20% salt solution depends on which side of the cell membrane has the higher concentration of solute. A 20% sodium chloride solution has a molar concentration close to four. The concentrations of ions and molecules in cells is in the millimolar (and lower) range, so the total concentration in the cells is at least an order of magnitude smaller than the salt solution. Entropy increase will be higher, if water leaves the cell to add volume to the salt water, that is, water passes spontaneously from the lower concentration solution to the higher. If water leaves the cells, they will lose volume and shrivel a bit, which should lead to a less rigid structure. The piece of vegetable from the salt solution should be less stiff, more flaccid. |
|||
3.
|
The predictions from items 1 and 2 are found to be true experimentally. This is most striking in the flaccidity of the vegetable in salt water, but also quite noticeable in the stiffness of the piece that was in pure water, especially as it is compared to the control. |
|||
4.
|
The vegetable piece in pure water becomes stiffer as the osmotic process adds water to the cells and they swell and push harder against one another. Pushing the cells against one another requires forcing water into the cells. The increase in stiffness is evidence that water has been moved against a restraining force by the osmotic process. The movement of water in or out of the vegetable cells is not observable in this Activity, but a different demonstration can make it observable. |
|||
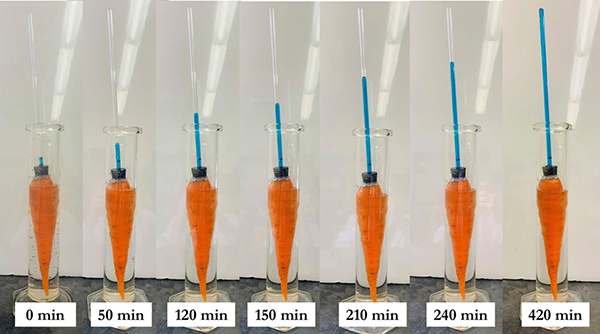
Figure 3 illustrates an osmosis set up that incorporates a carrot with its semipermeable cell membranes and demonstrates raising a column of solution against the force of gravity, as in Figure 1. A cavity was bored in a large carrot and filled with a 50:50 mixture of corn syrup and water dyed blue with food coloring. A one-hole rubber stopper containing a length of glass tubing was inserted in the cavity opening and sealed to the carrot with hot glue. This process leaves no air in the cavity and forces a bit of the solution into the tubing, as shown in the left-most image of Figure 3. The carrot was then inserted in a cylinder with enough pure water to come almost to the top of the carrot. (This set-up process, beginning with the addition of the sugar solution, can be somewhat messy. It should be done shortly before the demonstration is carried out, because the osmosis begins immediately, even before the carrot is placed in the water, as water from the carrot cells moves into the solution-filled cavity.) This demonstration leaves no doubt that water moves by osmosis from the plant cells into the cavity raising a column of liquid against the force of gravity, as in the subsequent time points in Figure 3. |
||||
|
||||
| Part A | ||||
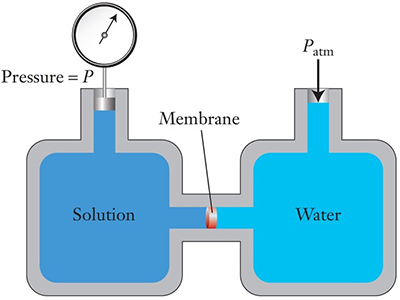
Osmotic pressure. Thermodynamic reasoning can be used to calculate the equilibrium state for an osmotic process, that is, the state shown in the drawing on the right in Figure 1, including the osmotic pressure (represented by ΔH). Osmotic pressure is usually symbolized by Π (uppercase Greek pi) and, for ideal solutions, is given by the equation Π = cRT Here, c is the molar concentration of the solution, R is the gas constant, 0.082 atm•L/mol•K, and T is the Kelvin temperature. Note that osmotic pressure depends on the concentration of the nonvolatile solute and not (in ideal solutions) on its identity. For practical purposes, dilute solutions approach ideality and can be reasonably characterized by this equation. (The properties of solutions of volatile solvents that depend only on the number of solute molecules and not their identity are called colligative properties. In addition to osmotic pressure, vapor pressure lowering, boiling point elevation, and freezing point depression are also colligative properties. The latter is examined in the Freezing point of a solution Activity.) Consider a 0.01 mol/L aqueous solution of a nonvolatile solute such as a sugar that cannot pass through the semipermeable membrane. The osmotic pressure of this solution at 25 °C (298 K) would be Π = (0.01 mol/L) ( 0.082 atm•L/mol•K) (298 K) = 0.24 atm A column of water a bit over 10 meters high is equivalent to one atmosphere pressure. A dilute solution of water has essentially the same density as pure water, so this osmotic pressure of 0.24 atm is equivalent to a 2.4 m [= (0.24 atm)(10 m/atm)] column of the solution. That is, if this solution were the solution in the left-hand arm at equilibrium in Figure 1, ΔH would be 2.4 m, or almost eight feet. Osmotic pressures are quite large. It is obviously impractical actually to measure osmotic pressure in an apparatus like that shown in Figure 1, if the tube has to be several feet high. In addition, flow of water into the solution would dilute it and make it harder to determine the solution concentration at equilibrium. Figure 4 is a schematic illustration of an apparatus for measuring osmotic pressure that avoids these problems. The apparatus can be used to determine the concentration of a solution by measuring its osmotic pressure and hence to calculate the unknown molar mass of a solute, such as a new, sparingly soluble, potential pharmaceutical. |
||||
|
||||
Although the thermodynamic analysis provides this powerfully useful result, it does not explain how the osmotic process works. What causes water to move from one side of the membrane to the other and why does it stop moving? The simplest explanation is that water on the pure water side exerts a higher pressure on the membrane than water on the solution side, so water is forced (pushed) from higher to lower pressure. As the osmosis proceeds the build-up of hydrostatic pressure and dilution on the solution side increases the water pressure of the solution until it equals the solvent water pressure and net flow stops—equilibrium has been reached. For this to be an acceptable explanation, we need a reasonable molecular-level mechanism that explains the proposed pressure difference and how it changes. |
||||
Osmotic mechanism. The molecules in fluids (gases and liquids) are in constant translational motion and continuously banging against the walls of their containers, thus creating pressure (force per unit area) on the walls. In gases, the molecules are far apart and the kinetic theory of gases assumes that they act independently of one another (if the pressure is not very high). The collisional pressure on the walls of the container is a function of two factors, the average momentum of the molecules (determined by their temperature) and the number of molecules per unit volume (which determines the number of collisions). Kinetic theory successfully describes gas behavior. The situation is quite different for liquids which are generally at least 1000 times more dense than the same molecules as a gas (at, say, atmospheric pressure). It’s obvious that the molecules in a liquid attract each other, since they hold together in a constant volume even in an open container. Another productive way to think about liquids versus gases is to consider the pressure that a liquid would exert on the walls of its container, if it obeyed the kinetic theory. Since there are 1000 times more molecules per unit volume, we would expect much higher pressure from their collisions with the walls. In an open container, the molecules would fly off the surface almost instantly. Obviously this is not the case, but what is happening? Liquids, especially low molecular mass compounds, are generally somewhat volatile and molecules do leave the surface. However, their vapor pressures (the force they exert to leave the surface) are not enormous. The attractions among molecules in the liquid (absent in gases) reduce the momentum with which they strike the walls and hence reduce the pressure they exert. For example, the vapor pressure of water is 23.8 torr at 25 °C. Even though container walls do not allow molecules to leave, their collisions with the walls exert the same pressure as if the walls were not there, that is, the vapor pressure of the liquid. What is relevant to our discussion of the osmosis mechanism is that the vapor pressure of volatile solvents is lowered when nonvolatile solutes are dissolved in them. For example, the vapor pressure of a 1.70 molar glucose solution (97 mole percent water) is 23.1 torr at 25 °C. (We pointed out above that vapor pressure lowering is a colligative property.) Now we have a difference in pressure on opposite sides of the osmotic membrane. The higher vapor pressure of the pure solvent compared to the solution means the pressure is higher on the solvent side of the membrane. The “push” will be for solvent to flow from the solvent side to the solution side. [Note that vapor pressure lowering of a solution is directly dependent on the concentration of the solute—the more solute, the lower the vapor pressure. Thus, if there are solutions on both sides of the membrane, osmosis will occur in the direction from the lower concentration (higher vapor pressure) to higher concentration (lower vapor pressure) solution.] So, to understand the molecular basis of osmosis, we need to know why a nonvolatile solute reduces the vapor pressure of a volatile liquid. In the pure solvent, all the molecules are chaotically jostling about. All this motion is the source of the momentum (reduced by the intermolecular attractions) that creates the pressure at the walls of the container. When solute molecules dissolve in the solvent, a layer of solvent molecules, a solvation layer, forms around each one. Some of the attraction of the solvent molecules in the solvation layer is to the solute molecule instead of other solvent molecules. They are loosely “held” in place and effectively removed from the motion of the rest of the solvent. This reduction in the number of jostling solvent molecules reduces the momentum available to produce the pressure at the walls and a solution has a lower pressure than the pure solvent. Finally, why does the osmotic process stop? How does putting pressure P on the solution in Figure 4 cause osmosis to stop? Putting pressure on the solution pushes the molecules closer together. Liquids are not very compressible, so high pressure is required to push the molecules even a little closer together. The reason is that trying to get the molecules closer increases the repulsions between them as their nuclei and electron clouds repel. Increasing repulsion counteracts some of the attraction among the molecules with the effect that the net attraction is decreased. Since molecular attractions reduce the momentum of molecules striking the walls, decreasing the attractions should result in increased momentum and increased wall pressure. (In other words, increasing the hydrostatic pressure on the liquid increases its vapor pressure. This is an experimentally observed phenomenon.) At some pressure, the osmotic pressure, the increase in momentum on the solution side balances the momentum on the solvent side and osmotic flow stops. Central to this proposed mechanism for osmosis is the idea that solvent molecules in the solvation layer around the dissolved solute molecules lose their freedom of motion, which reduces the overall motion of the solvent. You can think of this as a loss of solvent “activity”. This same concept is central to the interpretation of the experimental data in Solubility patterns [this activity is still in progress] and touched upon in Reaction energies and entropies. (The loss-of-solvent-activity concept explains why oil and water do not mix and is important in understanding the folding of protein chains into their active forms as enzymes.) Our description of osmosis was incomplete, because it did not include the energetics of the process. Consider in Figure 1 that solution has been raised from its initial to final state. It takes work to raise a mass in the gravitational field of the Earth and this energy has to come from somewhere. Since the liquids don’t change temperature during osmosis, the energy must be thermal energy from the surroundings. Conversely, work has to be done in Figure 4 to exert the pressure on the solution and thermal energy must be transferred to the surroundings to keep the temperature constant. These energies are accounted for in the thermodynamic analyses of the process that are independent of the actual molecular mechanism. |
||||
A bit of quantum mechanics and entropy analysis. The above “mechanical” picture of osmosis based on molecular collisions, attractions, and repulsions, helps to visualize the forces involved. More abstract analyses reinforce the picture. The Heisenberg uncertainty principle, fundamental to quantum mechanics, states that the product of the uncertainties in momentum, Δ(momentum), and position. Δ(position), of a particle is of the order of the size of the Planck constant: Δ(momentum) × Δ(position) ≈ h When pressure is applied to the solution in the osmosis process, the molecules are forced slightly closer together. Each molecule has a smaller volume to move in, so the uncertainty in its position decreases. If Δ(position) gets smaller, Δ(momentum) must get larger, in order to satisfy the Heisenberg uncertainty equation. Increased uncertainty in the momentum means that the spread of momentum values has increased and increased momenta are more likely, just as we concluded from the mechanistic picture. As we have pointed out, at the beginning of the osmotic process, the entropy of the solution (a mixture) is higher than the entropy of the pure solvent. Thus movement of solvent into solution is the favored, spontaneous direction of change. When equilibrium is reached, there is no net movement of solvent. That is, neither the solution nor the solvent is favored, so their entropies must be the same. What has changed is the large hydrostatic pressure squeezing the molecules closer in the solution. The discussion in the Direction of change and entropy Activity indicated that the energy level spacings in a system depend on its volume with larger spacings for smaller volumes. With the same amount of energy to distribute, larger spacings result in fewer distinguishable energy distributions and lower entropy. This decrease in entropy, as the solution is compressed, offsets the unchanged entropy of mixing, to make the entropy of the solution the same as the solvent. You have to use your judgment whether to use any of these ideas about the osmotic mechanism with your students. Whatever you choose, do not suggest (as some texts do) that osmosis is a diffusion process. It’s enticing to think about it that way, but diffusion cannot create a force that would lift a column of solution. And, even if it could, the process could never come to equilibrium in a system like that in Figure 1, since there would always be a difference in concentration. |
||||
Part C |
||||
5.
|
The osmotic process comes to equilibrium when the force pushing solvent through the semipermeable membrane is the same on both the solvent and solution sides of the membrane. This happens when a certain hydrostatic pressure, the osmotic pressure, has built up on the solution (represented by ΔH in Figure 1 and by P – Patm in Figure 4). Before this point is reached, the spontaneous flow of solvent is from solvent to solution. It makes sense to think (correctly) increasing the hydrostatic pressure on the solution (making the pressure higher than the osmotic pressure) should further increase whatever happened in the solution to bring it to equilibrium. (In the model above, the extra pressure would squeeze the molecules even closer together, further increasing their repulsions and decreasing the net attractive forces. And the change in entropy discussed just above would also be in the direction to make movement of solvent from the solution to the solvent favorable.) This would take the system past the equilibrium point and make the flow of solvent from the solution to the solvent spontaneous, thus reversing osmosis. |
|||
Reverse osmosis, climate change, and drought. Reverse osmosis can produce drinkable water from solutions such as seawater or other impure water containing dissolved solutes. This is important, because the world is running out of fresh water suitable for drinking and agriculture, Figure 5. Climate change exacerbates the problem as disrupted weather patterns increase drought in many places. In Cape Town, South Africa, for example, authorities warned that the municipal water supply for its 4,000,000 residents would be turned off in July 2018, if there was no rain to replenish the reservoirs—their drought began in 2015. (Strict water conservation measures sufficed to prevent this draconian measure, but shortages have continued.) In the United States, the flow of the Colorado River, fed largely by snow melt, has decreased to the point that it is no longer replenishing the water in Lake Mead (formed by the Hoover Dam) as it should. In August 2021, for the first time in its 85 year history, the lake’s water level fell so low that the federal government had to declare cuts to the amount of water allowed for use from the lake in Nevada, Arizona, and Mexico. |
||||
|
||||
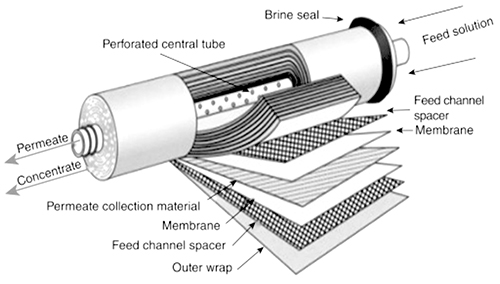
There is, of course, abundant water in the oceans and seas of the world, but it is not drinkable or useful for agriculture and many industrial processes, because it contains a great many salts. Reverse osmosis offers one way to obtain pure water from seawater. To make this work, the salty water is put under very high pressure on one side of a semipermeable membrane. In principle, as described above in the response to item 5, if the pressure is greater than the osmotic pressure of the solution, water will flow from the solution through the membrane to be collected on the other side. In practice, osmosis and its reverse are slow, mainly due to the substantial resistance to flow through the membrane. Thus, we need a thin membrane to reduce resistance to flow and a large area of membrane to increase the surface available for the flow to occur. We also want this to be as compact as possible, so the pressure vessel that contains the membrane does not have to be enormous. Figure 6 shows a design that accomplishes these goals. |
||||
|
||||
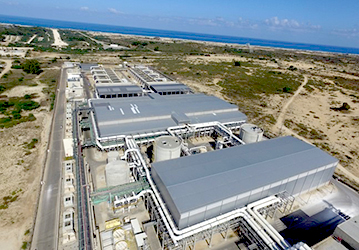
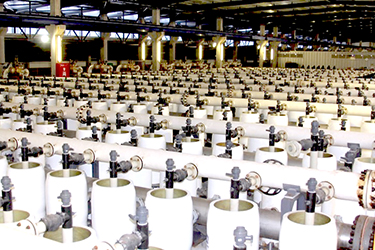
A drawback for reverse osmosis is the large amount of energy required to put high pressure on the salt water. Some of this energy is required just to overcome the mechanical drag on the water molecules passing through the membrane at high enough volume to make the process a viable way to purify a lot of water. Substantial research goes into developing new membrane materials that can be as thin as possible. A second problem is what to do with the more highly concentrated salt solution from which some water has been removed. If it is returned to the body of water from which it came, it will cause at least local increases in salinity that can upset the ecosystem. Thus, care has to be taken in disposing/dispersing the concentrate. Essentially every country that has borders on a sea has reverse osmosis desalination plants and more are being built. (Cape Town is constructing four and Arizona and Mexico are discussing a shared desalination plant on the Mexican coast.) At present, the world’s largest seawater reverse osmosis facility is the Sorek plant, Figure 7, near Tel Aviv, Israel. It desalinates water from the Mediterranean Sea, producing 624,000 m3/day, about 20% of what the country uses. |
||||
|
||||
|
||||
To obtain a Word file of this Activity, please fill out this brief form to help us track what is happening to our Workbook. We also encourage you to get in touch if you have an activity or idea for an activity that might add to the Workbook. We want to make this an alive and active document. |
||||
 |