Freezing point of a solution
|
Freezing point of a solution |
Background |
|||||||||
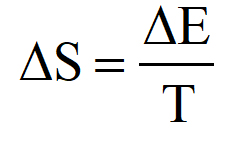
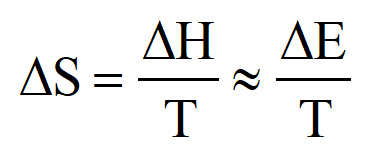
The solution you will study in this Activity is sodium chloride, NaCl (table salt), dissolved in water. When aqueous solutions of non-volatile solutes, such as salt water or seawater, freeze, the solid that forms is essentially pure water ice without solute. If that is the case, is the freezing point of the solution different than or the same as for pure water? Changes in physical systems, like the phase change from solid to liquid (or the reverse), always involve energy and entropy changes. Energy may be required, for example, to break bonds between molecules (or be released when bonds are formed). At the molecular level, entropy is a measure of the number of ways the energy of a system can be distributed among the molecules—the more ways, the more probable the system. Changes occur in the direction toward more probable systems, that is, in the direction of increasing entropy. For a certain amount of energy in a given molecular system, the number of ways to distribute the energy depends on the freedom of motion of the molecules. In the solid, the molecules (or atoms or ions) are held in place in the solid structure, so their motions are limited and the entropy is low. In the gas, the molecules are far apart and free to move anywhere in their container and the entropy is high. The liquid phase is an intermediate case with an intermediate entropy. The molecules are close together, but not held in one place, and able to move about within the constraints of the attractions between them. Mixtures of two or more different kinds of molecules multiply the number of possible energy arrangements, compared to a system of identical molecules. This is because the same amount of energy can be apportioned in many different ways among the different kinds of molecules. An important and fundamental concept for understanding and analyzing this Activity is this relationship among entropy change, energy change, and temperature: (This relationship was introduced and rationalized for countable systems in the Direction of change and entropy Activity. You may have learned about it another way, which is fine.) The sign of ΔS and ΔE is the same for a system where gain or loss of energy is the only change. And the entropy change is inversely proportional to the Kelvin temperature of the system. This relationship is usually expressed in terms of enthalpy change, ΔH, instead of ΔE, but for changes in condensed phases—solids and liquids—ΔH and ΔE are essentially the same. This relationship can link your understanding of the molecular level interpretation of entropy to analyses of changes in observable, macroscopic systems that are introduced here. |
|||||||||
A. Solid-liquid phase change |
|||||||||
|
|||||||||
| Procedure | |||||||||
(i) Fill each cup about three-quarters full of ice. Place a thermometer in each cup of ice and stir until the thermometer has reached ice temperature. Add ice-cold water to one cup and ice-cold salt water to the other. Continue stirring and reading the temperatures until each remains constant (within ±0.1 °C) for 20-30 seconds. Record these temperatures. (ii) About every two or three minutes, for the next 12 minutes or so, stir each mixture for several seconds and then read and record the temperature and time. When finished, the mixtures may be discarded down the drain. |
|||||||||
| Analysis | |||||||||
1.
|
For part (i), what was the temperature you read for the ice-water mixture? For the ice-salt-water mixture? Were these results surprising? If so, what was surprising? If not, what previous experience led you to expect these results? |
||||||||
2.
|
At Tm, the melting point of a pure solid, which is the same as Tf, the freezing point of the pure liquid (Tm = Tf), the solid and liquid phases are in equilibrium. When a solution of a non-volatile solute freezes, the solid “product” consists of pure solvent. How (directionally) is the freezing/melting point of a solution related to the freezing/melting point of the pure solvent? What is the evidence for your answer? |
||||||||
3.
|
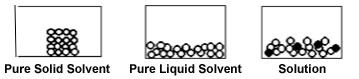
These diagrams are schematic illustrations of the pure solid solvent, the pure liquid solvent, and a solution of a non-volatile solid dissolved in the liquid solvent. Based on what you know about entropy, which of these has the lowest entropy? the highest entropy? Explain your reasoning. |
||||||||
4.
|
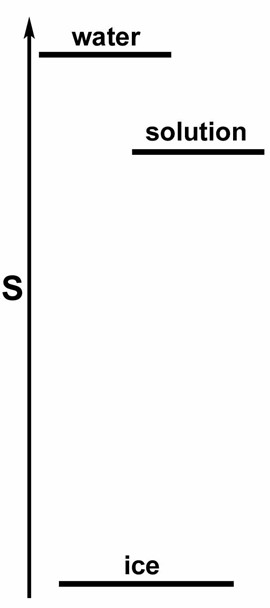
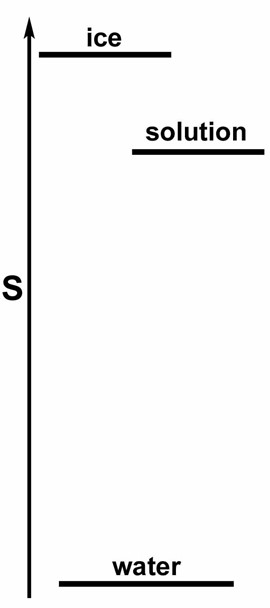
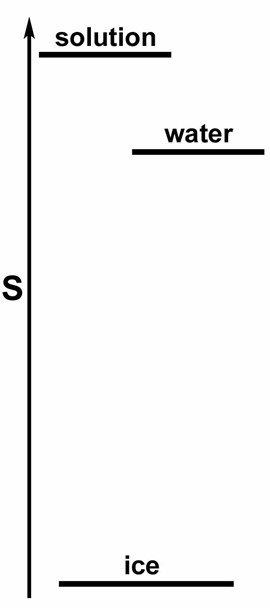
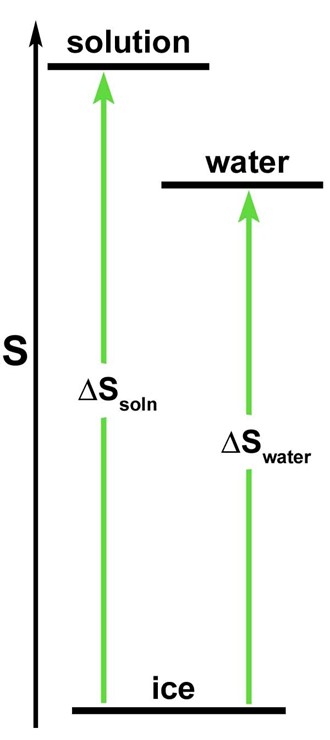
Which of these entropy level diagrams represents the relative entropies of the components of the systems: ice, water, and salt water solution? Explain the reasoning for your choice.
|
||||||||
5.
|
On your selected diagram from item 4, draw arrows showing the entropy changes for the processes of ice melting in an ice-water system, ΔSwater, and in an ice-salt water solution system, ΔSsoln. The enthalpy change for ice melting, ΔHmelt, is the same in both systems, because the phase change is identical—solid water to liquid water. Let Twater and Tsoln be the temperatures at which the melting occurs in these systems. Use the energy-temperature-entropy relationship for each system to find out how their melting temperatures compare. Will the predicted melting-freezing point in the solution be higher, the same as, or lower than the melting-freezing point in pure water? |
||||||||
6.
|
Do the experimental freezing points confirm your analysis in item 5? Does it make sense in terms of the inverse relationship of entropy change to system temperature? Clearly explain your reasoning. |
||||||||
7.
|
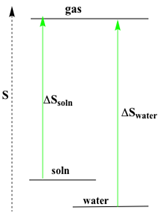
Liquid-gas phase change. It’s less convenient to do experiments on liquid-gas phase change, but you can carry out an entropy analysis to determine whether the boiling point of a solution of a nonvolatile solute (like a salt water solution) will be higher than, the same as, or lower than the boiling point of the pure solvent. Begin by constructing an entropy level diagram for the gas, liquid, and solution analogous to the correct one in item 4. Use the information in your diagram to help direct your analysis of the relative boiling points of the water and salt water. (The enthalpy change for both processes is the same, since both involve liquid water changing to gaseous water at one atmosphere pressure.) |
||||||||
8.
|
Return to solid-liquid phase change. In part (ii) did the temperature of the ice-water mixture increase, decrease, or stay the same? Is this what you expected? Explain your response. |
||||||||
9.
|
In part (ii) did the temperature of the ice-salt-water mixture increase, decrease, or stay the same? Is this what you expected? Explain your response. |
||||||||
10.
|
In part (ii), did either set of melting point temperatures change with time? If so, did they decrease or increase? If the two sets of temperatures behaved differently, there must be some difference in the change(s) taking place in them. What do you think the difference might be? How would it explain the direction of any temperature differences you observe? Explain your reasoning. |
||||||||
11.
|
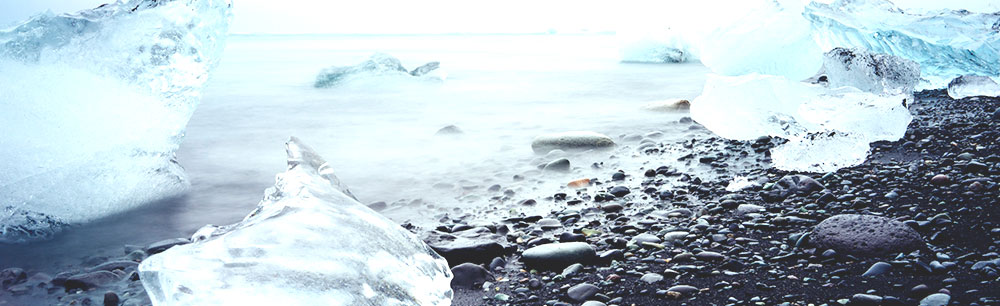
The birth and death of an enormous Antarctic iceberg are the subject of a 26 January 2022 New York Times online article by Henry Fountain. Excerpts of the article are given here. Do you see any relationship(s) between what happens as the iceberg dies and your observations on the freezing/melting points of aqueous solutions? Explain clearly the evidence for your response.
|
||||||||
 |
|||||||||
Instructor/presenter notes |
|||||||||
This is a stand-alone Activity to follow some introduction to the entropy concept that captures the ideas from the Direction of change and entropy Activity recapped in the Background. It is designed as the final section of that Activity. If you use it that way, you can delete most of the Background material in this Worksheet, or use the content as a refresher. |
|||||||||
| Part A | |||||||||
Getting to “constant” temperature after adding the water or salt water requires stirring the mixtures, which can be done with the thermometers (or temperature probes, if this is done as a class demonstration with the temperatures projected for all to observe), if done gently. Starting with ice-cold solutions from an ice bath or refrigerator reduces the amount of time necessary to reach “constant” temperatures. Ice-cold solutions are not critical, but are efficient. Careful observation usually shows a slow increase in temperature of the ice-salt water mixture after its lowest value has been attained. This phenomenon is explored after the lowest freezing point has been determined and is a result of the ice melting, diluting the solution, and making the freezing point depression smaller. |
|||||||||
1.
|
The freezing point of the ice-water mixture should be within ±0.1 °C of 0 °C, if the mixture is well mixed and the thermometer is accurate. The freezing point of the ice-salt-water mixture should be several degrees lower. The value will be somewhat different for each group, because it depends on how much ice has melted to dilute the solution before the minimum temperature is reached. Some students may be surprised by this result, although it’s likely they expect something to happen (be different), else why do the experiment. In areas with winter ice on roads and sidewalks, students are likely to be familiar with the usual treatment with salt to “melt the ice”, which is actually to lower the freezing point of water, so ice does not form. This should be discussed and a problem with this method pointed out—only a limited freezing point lowering is possible, as exemplified by the ice-salt water mixture here reaching a limit and getting no colder. Experiments with different salts at the same concentration could be encouraged. (Although highly unlikely in this modern age, there may be a student who has made ice cream in an old-fashioned ice cream maker with the metal container of ice-cream mix cooled in a mixture of ice and rock salt.) |
||||||||
2.
|
The experimental observation is that the freezing/melting point of the solution is lower than that of the pure solvent. Drawing a general conclusion from a single example is, of course, dangerous, but this is a general result. The direction of the effect of the larger number of ways to distribute energy in a solution of a non-volatile solute (higher entropy) compared to pure solvent is the same for all solvents and solutes. The way the difference in entropy affects the equilibrium temperature for the phase change is the subject of item 5. |
||||||||
3.
|
Molecules in crystalline solids are held in place in the crystal lattice with little freedom of movement (large energy level spacing, as discussed in Direction of change and entropy) and, therefore, low entropy. The solid solvent has the lowest entropy. Solutions/mixtures, with more different ways to arrange their energy, have higher entropy than pure solvent. The solution has the highest entropy among the three cases represented in the drawings. |
||||||||
4.
|
Using the information from the previous item, choose the entropy level diagram with the highest entropy component, the solution, at the top and the lowest entropy component, the solid solvent, at the bottom. This is diagram C, with the solution at a higher entropy level than pure water. |
||||||||
5.
|
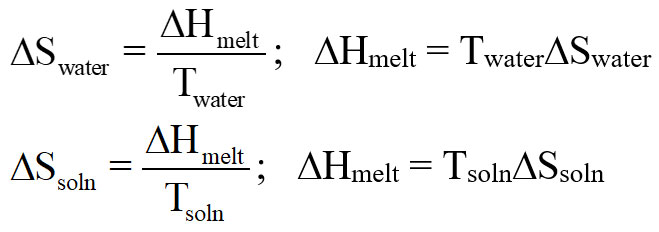
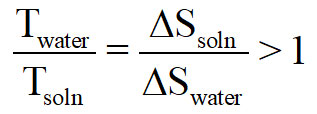
Arrows representing the entropy change for melting ice in water and in salt water are drawn here on the entropy level diagram that was shown in the previous item to describe this system. Write the energy-temperature-entropy expressions for ice melting in pure water and the solution and solve each for ΔHmelt. Since the left-hand sides of the rearranged expressions are identical, we can equate the right-hand sides, TwaterΔSwater = TsolnΔSsoln. Rearrange this equality and use the relative lengths of the arrows as a guide to give |
|
|||||||
6.
|
This result shows that the freezing/melting point temperature of a solution is lower than the freezing point of the pure liquid, which is what is observed experimentally. This is what one would expect, based on the energy-temperature-entropy relationship. For processes with the same energy (enthalpy) change, the entropy change and temperature are inversely proportional. The larger entropy change (from solid to solution, ΔSsoln) should be associated with lower temperature, as found experimentally. |
||||||||
7.
|
This is the entropy level diagram for pure water, a solution of a non-volatile solute in water, and gaseous water (water vapor). The gaseous state has the highest entropy and the solution has a higher entropy than the pure liquid, since it is a mixture. The enthalpy change in both cases is the same, ΔHvap, for water vaporizing at one atmosphere pressure (the boiling point). By the reasoning of the previous item, the temperature associated with the smaller entropy change, ΔSsoln, should be higher, that is, the boiling point of the solution should be higher. This is the boiling point elevation observed for solutions. |
|
|||||||
8.
|
As long as there is still ice in the ice-water mixture and it is stirred to be sure the temperature is the same throughout the mixture, its temperature should not change with time. Since essentially all students have learned that the freezing point of water is 0 °C and the temperature remains near this value, it is the expected outcome of the observations and there are no surprises. |
||||||||
9.
|
Usually, over several minutes, the temperature of an ice-salt-water mixture will increase. This might seem surprising, since the same phenomenon is not seen with the ice-water mixture. |
||||||||
10.
|
The ice-water mixture remains at about a constant 0 °C, while the ice-salt-water mixture starts at a temperature below 0 °C and increases somewhat as time passes. Experience tells us that the ice in a mixture of ice in water or other aqueous solution will eventually melt, if left at room temperature. It’s likely that the ice in this activity is also melting. This does not seem to have an effect on the melting temperature of the ice-water mixture, but something else must be going on in the ice-salt-water mixture to cause the melting temperature to change. A clue to the cause of the change is that the melting temperature of the ice-salt-water mixture is approaching the melting temperature of the ice and pure water mixture. As ice melts in the ice-water mixture, there is no change in the composition of the liquid. But, as ice melts in the ice-salt-water mixture, the solution becomes more dilute as fresh water from the ice is added. Evidently, the melting temperature of a salt-water solution depends on the concentration of salt in the solution. This conclusion is true and is demonstrated by these simple observations. Of course, it can be quantified by more carefully controlled experiments and derived theoretically by quantitative thermodynamic analysis that is not appropriate for this basic introduction to the entropy concept. |
||||||||
11.
|
The connection of the story of the iceberg’s demise to this Activity is the reasoning that fresh water melting from ice into salt water (the sea) can affect the behavior of the solution. It changes the salinity and hence the environment for the organisms that have evolved to depend upon the salinity. In very simple terms, dilution makes it harder to find and assimmilate the solutes like calcium ion or carbonate ion that many phytoplankton need. Freshening the sea also changes its density and the consequences of this effect are discussed in the Density and behavior of ice-water mixtures Activity. |
||||||||
|
|||||||||
To obtain a Word file of this Activity, please fill out this brief form to help us track what is happening to our Workbook. We also encourage you to get in touch if you have an activity or idea for an activity that might add to the Workbook. We want to make this an alive and active document. |
|||||||||
 |