Density and behavior of ice-water mixtures
|
Density and behavior of ice-water mixtures |
A. Melting ice and density |
|||||||||||
Water is a unique substance that is essential for life as we know it. It’s the only common substance that exists in all three phases—solid, liquid, and gas—under the conditions at the surface of the Earth. It’s so ubiquitous and familiar that we hardly give its properties a second (or even first) thought. For example, almost everyone has added ice to a beverage to cool it, but rarely notices how the solid and liquid interact or what happens to the melt water when the ice melts. These are the sorts of issues you will investigate in these activities. Density is usually quantified in units of mass per volume, but, sometimes, a more “pictorial” approach makes a lot of sense. That is, density is a measure of the amount of “stuff” contained in a given volume—the more stuff, the greater the density. If a substance is made of tightly packed stuff, so the stuff is crammed close together, its density will be higher than another substance made of the same stuff but more loosely packed. Floating and sinking can sometimes be used as criteria for determining relative densities. For example, if object A floats on a given liquid and object B sinks in the liquid, object B is more dense than object A. Also, object B is more dense than the liquid and object A is less dense than the liquid. These ideas may be useful when interpreting the results of these activities. |
|||||||||||
|
|||||||||||
| Procedure | |||||||||||
Fill one cup three-quarters full with clear, colorless water and the other with clear, colorless 10% salt solution. What do you expect to observe when you first add one of the ice cubes to each cup? If you expect to see changes, how will you be able to verify if they have occurred? As time passes, what do you expect to observe in each cup? What changes do you expect? What do you expect to stay the same? How will you be able to verify if your expectations are correct? When you are ready and have prepared to answer these questions, place a colored-water ice cube in the liquid in each cup. Closely observe what happens in each cup. You might find it best to view the contents of the cups against a white background. Record your observations for several minutes and then begin the analysis. |
|||||||||||
Analysis and interpretation |
|||||||||||
1.
|
What were the very first observations you made when the solid cubes were added to the liquids? Were they what you expected? Explain why or why not and the evidence for your response. At the molecular level, what similarities and differences between solid ice and liquid water would explain your observations? Clearly state your reasoning. |
||||||||||
2.
|
What did you further observe during the time after the ice was added to the cup of fresh water? Was this what you expected? Explain why or why not and the evidence for your response. What property(ies) of the melt water is(are) different from those of the original, room temperature water? What is a molecular-level explanation for the difference(s)? Clearly present the evidence and reasoning for your responses. |
||||||||||
3.
|
What did you further observe during the time after the ice was added to the cup of salt water? Was this what you expected? Explain why or why not and the evidence for your response. What property(ies) of the melt water is(are) different from those of the original, room temperature salt water? What is a molecular-level explanation for the difference(s)? Clearly present the evidence and reasoning for your responses. |
||||||||||
4.
|
List these substances in order of increasing density: fresh (unsalty) room temperature water, salty room temperature water, fresh cold water, and solid ice. Explain the reasoning and evidence for your choices. |
||||||||||
5.
|
How might you amend or add to the activity to provide further evidence for your explanation in items 2 and 3? If possible, carry out your suggestion, describe the results, and explain whether understanding of what is going on has been enhanced. |
||||||||||
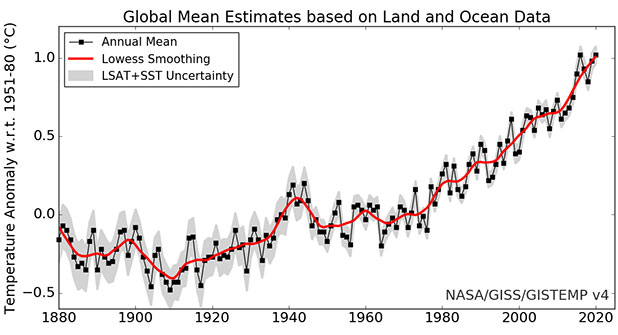
As human activities add CO2 and other greenhouse gases to the atmosphere, the Earth warms. |
|||||||||||
|
|||||||||||
6.
|
On a warming Earth, the seas warm and, also, glaciers and ice sheets melt and add their water. Both these phenomena contribute to rising sea levels. Explain clearly how your observations in this ice cube activity show why they raise the sea level. Arctic sea ice is also melting and opening new shipping lanes. What do the observations in this activity tell you about the possible contribution of this ice melt to sea level rise? Explain your reasoning. |
||||||||||
B. Oceans, ice, and climate |
|||||||||||
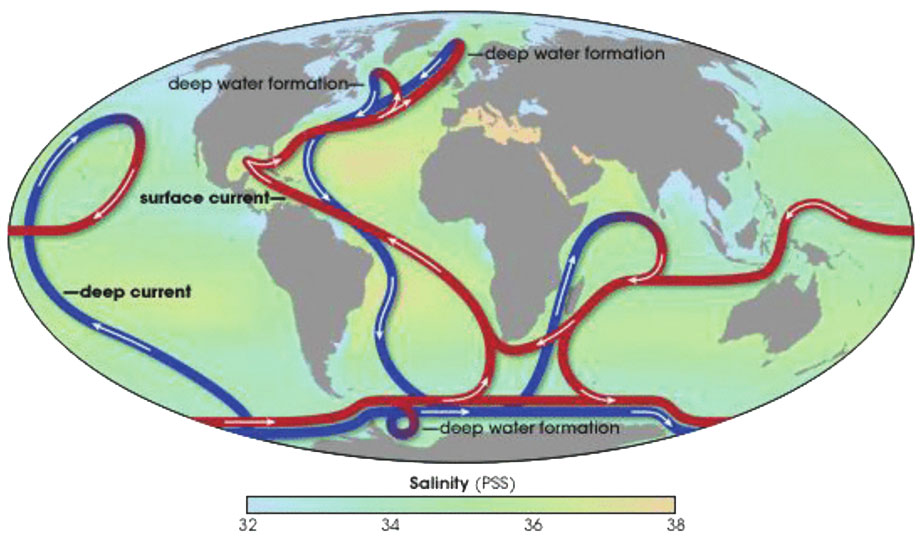
Figure 2 is a schematic diagram showing the pathway of the Earth’s thermohaline ocean current (conveyor belt) that moves immense amounts of water, energy, and solutes around the planet from the surface to the depths of the sea and back. |
|||||||||||
|
|||||||||||
Food for thought: the following entries are the abstract of an article on this current and a newspaper report on the article. Oltmanns, M., Karstensen, J., and Fischer, J., “Increased risk of a shutdown of ocean convection posed by warm North Atlantic summers,” Nature Climate Change, 2018, 8, 300-304. |
|||||||||||
|
A shutdown of ocean convection in the subpolar North Atlantic, triggered by enhanced melting over Greenland, is regarded as a potential transition point into a fundamentally different climate regime. Noting that a key uncertainty for future convection resides in the relative importance of melting in summer and atmospheric forcing in winter, we investigate the extent to which summer conditions constrain convection with a comprehensive dataset, including hydrographic records that are over a decade in length from the convection regions. We find that warm and fresh summers, characterized by increased sea surface temperatures, freshwater concentrations and melting, are accompanied by reduced heat and buoyancy losses in winter, which entail a longer persistence of the freshwater near the surface and contribute to delaying convection. By shortening the time span for the convective freshwater export, the identified seasonal dynamics introduce a potentially critical threshold that is crossed when substantial amounts of freshwater from one summer are carried over into the next and accumulate. Warm and fresh summers in the Irminger Sea are followed by particularly short convection periods. We estimate that in the winter 2010–2011, after the warmest and freshest Irminger Sea summer on our record, ~40% of the surface freshwater was retained. |
||||||||||
Mooney, C., “The fast-melting Arctic is already messing with the ocean’s circulation, scientists say,” Washington Post, 14 March 2018. |
|||||||||||
|
Scientists studying a remote and icy stretch of the North Atlantic have found new evidence that fresh water, likely melted from Greenland or Arctic sea ice, may already be altering a key process that helps drive the global circulation of the oceans. In chilly waters on either side of Greenland, the ocean circulation “overturns,” as surface waters traveling northward become colder and denser and eventually sink, traveling back southward toward Antarctica at extreme depths. This key sinking process is called convection. But too much fresh water at the surface could interfere with it, because with less salt, the water loses density and does not sink as easily. In the new research, Marilena Oltmanns and two colleagues at the GEOMAR Helmholtz Center for Ocean Research in Kiel, Germany, found that following particularly warm summers in the remote Irminger Sea, convection tended to be more impaired in winter. In some cases, a layer of melt water stayed atop the ocean into the next year, rather than vanishing into its depths as part of the overturning circulation, which has sometimes been likened to an ocean “conveyor belt.” |
||||||||||
7.
|
Are the observations you made in Part A of this activity related to the phenomena observed and reported in this research? Explain your reasoning. |
||||||||||
C. Seasonal change: another climate science connection |
|||||||||||
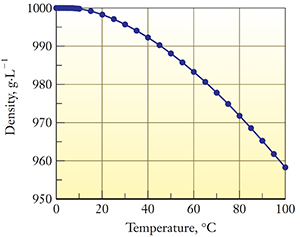
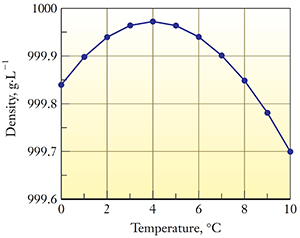
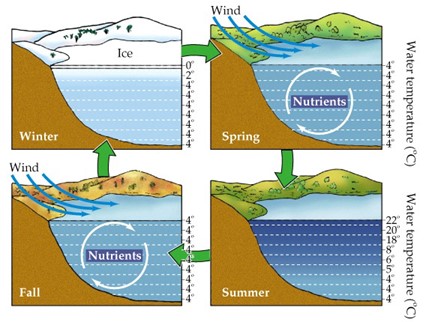
Solid water (ice) is less dense (917 g·L–1 at 0 °C) than liquid water (≈1000 g·L–1 at 0 °C) and floats on the liquid. No other common substance has this property—expanding upon solidifying. At temperatures above 4 °C, the volume of liquid water, like all liquids, increases (expands) as the temperature rises. However, pure liquid water is unique in having a maximum density (minimum volume) before it solidifies, Figure 3. What are the consequences of these properties for the behavior of an ice-water mixture on the demonstration table or a freezing lake, Figure 4? |
|||||||||||
|
|||||||||||
|
|||||||||||
8.
|
How, if at all, is the ice-cube activity related to the phenomena illustrated in Figure 4? Explain your reasoning. |
||||||||||
9.
|
Wind is shown as a driver of the spring and fall changes in Figure 4. What is(are) the role(s) of the wind in bringing about the changes from summer through fall to winter and from winter through spring to summer? Are the properties of the fall and spring winds the same? What property of the winds is probably most important for its effect on the system? Clearly explain your reasoning. |
||||||||||
10.
|
The Earth is warming. The average atmospheric temperature has risen by at least 1 °C since the beginning of the Industrial Revolution. How might this affect the property of the winds you noted in item 9? What effect could this have on the processes illustrated in Figure 4? |
||||||||||
11.
|
If solid water was not less dense than the liquid, what effect might this have (or have had) on life as we know it? Explain. |
||||||||||
 |
|||||||||||
Instructor/presenter notes |
|||||||||||
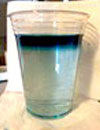
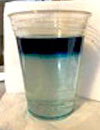
Part A of this Activity should be completed and discussed before going on. Part A could be presented without any worksheet. Since seeing ice in water is such a common experience, it might seem odd to ask students what they expect to observe when the ice cubes are added to the liquids. It’s very likely that essentially all will say that the ice cubes will float, which will be easy to verify. Hopefully, they will also suggest that the liquid level in the cups will rise when the ice cube is added. To verify that this might happen, students should mark the liquid levels in the cups before the ice cubes are added and then again after they are added. The rise will be easier to see, if the ice cubes are relatively large. Further suggestions might be that the ice cubes will melt and there may be some suggestions about what will happen to the cold blue melt water. If necessary, finally, you should prompt a suggestion about the liquid levels after the ice cubes have melted. Marking the liquid levels in the cups, before and after the ice is added, will test the possibilities. Figure 5 shows results from a classroom demonstration (somewhat larger scale than you would want individual groups to do). |
|||||||||||
|
|||||||||||
After students put the ice cubes in the water and salt water and make their initial observations (noting and marking the old and new liquid levels), lead a discussion modeled on the analysis items in the worksheet. Among the ideas to emphasize, include addition of ice to water causes the liquid level to rise, but that melting of floating ice does not change the liquid level. Adding water molecules that were not already in the liquid increases the volume of the liquid, so the cup is fuller and the level rises. Water molecules that are already floating (ice) has already displaced its mass of liquid, so its melting adds no new volume and the liquid level in the cup does not change. The relationship to climate change is that water from melting land ice (glaciers and ice sheets, like those on Greenland and Antarctica) adds water to the oceans and is a cause for sea level rise. Melt water from ice that is already floating (like on the Arctic Ocean) does not add volume to the ocean and does not raise the sea level. Sea level rise, including both thermal expansion of the sea water and addition of melt water from the land, are at the heart of item 6 (qualitatively) and discussed more quantitatively in Temperature, water volume, and sea level. To make further climate science connections, the concepts illustrated in Figure 2 should be introduced during this discussion. Sinking of colder water into less dense warmer water (exemplified by ice cube melt water sinking in pure water) is a major part of the mechanism that drives the immense ocean currents (the conveyor belt, Figure 2) that move water, energy, and nutrients around the planet. Colder seawater in the Arctic sinks into the less dense warmer water below. However, fresh water (less or no salt) floats on salt water, so it must be less dense and melting ice in the Arctic freshens the surface water, makes it less dense, and can slow the sinking process that drives the conveyor. If they have not already been distributed, the figure, abstract and article in Part B could be handed out as a takeaway reminder of the activity and its relevance to climate disruption. If you use Part B, you might poll your readers about which piece, the abstract or the article, they find easier to read and understand. Almost everyone, including scientists who are not familiar with oceanography, will probably find the newspaper article easier. This is an opportunity to discuss the importance of science reporting and communication for non-specialists and the general public. On topics as broad and diverse as climate science and climate change, trusted communicators and information sources are vital for keeping up with the science. Part C brings the temperature dependence of water density into sharper focus in a real-world example that has important consequences for freshwater aquatic life and is being affected by climate change in an observable way that can have economic consequences (see below). Although not relevant to this freshwater phenomenon, note that salty water, like seawater, does not have a maximum density before it freezes. Salinity (saltiness) is measured by the number of grams of NaCl (or equivalent) per liter of solution. As its temperature goes down, the density of a solution with salinity above about 20 increases continuously until the liquid begins to freeze (at a temperature below 0 °C). The shading of the seawater color in Figure 2 shows that the salinity of seawater is in the range 32 to 38. Responses and comments on the worksheet’s numbered items are given here: |
|||||||||||
Part A |
|||||||||||
1.
|
The very first observation is that the solids float on the liquids, just as predicted in the discussion before the ice is added to the liquid. This is so much a part of almost all students’ experience, that they might not recognize it as something to be noted as “an observation,” so a discussion of what constitutes “observation” could ensue. In order to float on the liquid, the solid has to be less dense than the liquid from which it is formed. The “stuff” from which both solid ice and liquid water are formed is the same: water molecules. So there must be fewer water molecules in a given volume of solid than in the same volume of liquid. The only way this is possible is for the molecules in the solid to be farther apart, on average, than they are in the liquid. It is unnecessary to know anything about the actual structure of the molecules or how they are packed together in the two phases to draw this conclusion. A second observation, rise of liquid level in the cup, can be connected to sea level rise as the Earth warms and land ice melts. |
||||||||||
2.
|
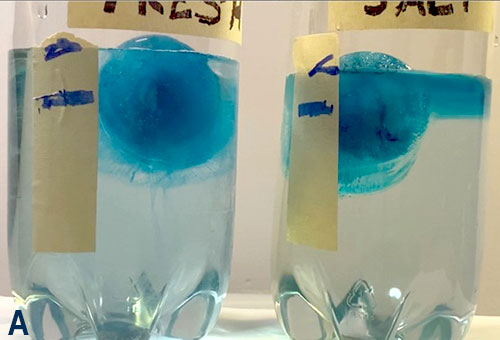
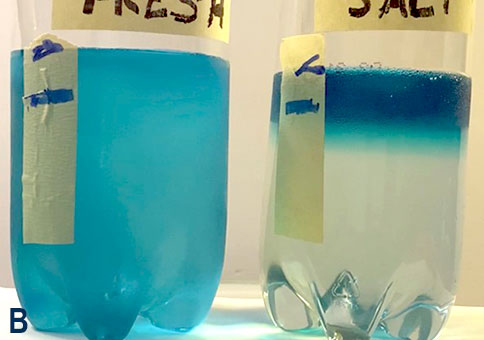
The ice cube’s surroundings, the room temperature water, are above its melting point, 0 °C, so the ice cube should be further observed to begin to melt, as evidenced by the formation of colored liquid around the cube (and decreasing size, as time goes by). The cold, colored water sinks toward the bottom of the cup in wispy streamers that dissipate as they fall and the colored water mixes into the surrounding warmer water (causing it to cool). Since the cold water sinks in the warmer water, cold water must be more dense than warmer water. Using the same argument as in the previous paragraph, we can conclude that the molecules in warmer water are farther apart than those in colder water. Because the molecules are getting farther apart, the liquid expands (takes up a larger volume) as it warms. This is true of all liquids and is the principle that is the basis for liquid-in-glass thermometers. A hands-on activity measuring the thermal expansion is part of Temperature, water volume, and sea level”. (These qualitative, directional conclusions are shown quantitatively in Figure 3.) Students should also verify that the liquid level in the cup stays the same as the ice melts in both the fresh and salt water. |
||||||||||
3.
|
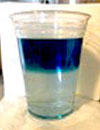
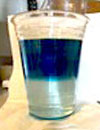
The ice cube in the room temperature salt water should be further observed to begin to melt, as evidenced by the formation of colored liquid around the cube (and decreasing size, as time goes by). Unlike the observation with pure water, the colored water from the melt remains on top of the colorless salt-water solution. Since the melt water does not sink in the warmer salt water, the salt water must be denser than the melt water. There doesn’t seem to be any reason that the water molecules in the salt water should be a good deal closer together than in cold fresh water, so there must be another factor making it more dense. The addition of sodium and chloride ions from the salt is the obvious difference between the salt and fresh water. The ions are likely to get mixed in among the water molecules and add to the “stuff” in a given volume, which increases the density of the solution. Over time (several days, Figure 6), the freshwater (with dye) will mix with the salt water and look exactly like the blue ice cube in pure water case. (If feasible, have at least a couple groups set aside their two cups where they won’t be disturbed and watch for several days. Cover the cups with pieces of cardboard or plastic wrap to prevent evaporation.) |
||||||||||
|
|||||||||||
4.
|
Cold fresh water floats on salt water and sinks in room temperature (warmer) fresh water, so it is more dense than warmer fresh water and less dense than salt water. The order of increasing density is: warmer fresh water < cold fresh water < salt water. Ice floats on warmer fresh water, so it must be the least dense of the four substances in this activity. You observed this directly for room temperature fresh and salt water when you found that ice floated on both. You can reason that ice would also float on cold fresh water, since it is more dense than warmer fresh water. You have probably observed something like this when preparing a glass of ice water. Even when the water gets very cold (near the temperature of the ice) the ice floats, which supports your reasoning. Thus, the order of increasing density is: ice < warmer fresh water < cold fresh water < salt water. |
||||||||||
5.
|
A simple addition to the activity would be to use a thermometer to measure the temperature of the liquid at various depths before and after adding the ice cube. As the activity proceeds, we would expect to observe the temperature decreasing as the cold colored liquid sinks into the pure water. This is further evidence that the explanation based on density as a function of temperature is correct. On the other hand, the temperature in the bulk of the salt water should remain pretty much as it began (except close to the top), because none of the cold melt water sinks into it. This is an easy experiment to try if more ice cubes, solutions, and thermometers are available. Students may think of other possible changes or alternatives to try and should be encouraged to test them, if possible, and to show how the results do or do not support their explanations for their observations. |
||||||||||
6.
|
A conclusion from the observations is that warmer water is less dense than colder water, so the molecules in warmer water are farther apart and a mass of warmer water takes up more volume than the same mass of colder water (as discussed in item 2). So the volume of the sea increases as its temperature increases. The sea level rises, because that’s the only way to accommodate the extra volume. Adding an ice cube to a container of water raises the liquid level and the level remains elevated when the ice cube melts. The same liquid level would be seen, if the ice cube was melted first and the melt water added to the container. Thus, melt water from glaciers and ice sheets adds to the volume and level of the sea. Sea ice is formed by freezing sea water and is floating on the surface. In the ice cube activity, this is just like what you see after the ice cube is added to the water. When that ice cube melts, the water level is unchanged, because the ice was already displacing exactly the volume of water it will form when it melts. Melting ice that is already floating does not contribute to rising sea level. |
||||||||||
Part B |
|||||||||||
7.
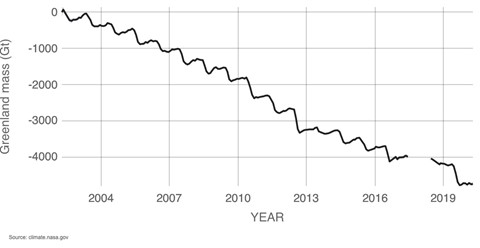
|
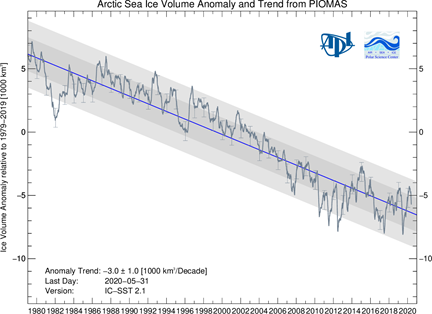
Fresh melt water floating on salt water is what is observed in this Activity, just as in the Arctic, where the melt water is from sea ice and the Greenland ice sheet. Figures 7 and 8 show that, in a warming world, Arctic sea ice and the Greenland ice sheet are melting away. The possibility raised in the referenced research and its interpretation is that the fresh melt water may be slowing the massive current (conveyor belt) that moves water, energy, and dissolved stuff around the Earth (from the tropics to the Arctic at the surface and south to Antarctica in the ocean depths and then back to the surface in the Pacific). This massive movement of the ocean’s water is called the Atlantic Meridional Overturning Current, AMOC. (The current is “meridional” because its major directional motion in the Atlantic is north-south, that is, along the meridians—longitudinal lines.) Slowing the current would have widespread effects on weather and climate throughout at least the northern hemisphere. The warmth transported from the tropics, for example, makes the English isles and Europe temperate places to live. Without this warmth, they would be uncomfortably cold. |
||||||||||
|
|||||||||||
|
|||||||||||
Since the flow of the AMOC is of such importance to human activities (like agriculture in northern Europe), cause(s) for changes in the AMOC flow are the subject of a great deal of research. Only since about 2004 have flow sensors been moored in the current where it flows near Greenland, so direct flow measurements are relatively recent. The impacts and interactions of natural variation and global warming on the AMOC are among the subjects of this research. If you, and/or your students are interested in the ocean conveyor belt, keep an eye out on the web for reports of research on the AMOC. Examples of such reports and articles include these: Chen, X. & Tung, K-K., “Global surface warming enhanced by weak Atlantic overturning circulation,”Nature, 2018, 559, 387-391. Caesar, L., McCarthy, G.D., Thornalley, D.J.R., Cahill, N. & Rahmstorf, S., “Current Atlantic Meridional Overturning Circulation weakest in last millennium,” Nature Geoscience, 2021, 14, 118-120. Velasquez-Manoff, M. & White, J., “In the Atlantic Ocean, Subtle Shifts Hint at Dramatic Dangers”, New York Times, March 2, 2021. An interactive article (with excellent graphics) that was prompted in part by the research study reported in the previous reference. |
|||||||||||
Part C |
|||||||||||
8.
|
The sinking cold water from the ice cube in the activity is analogous to the turnover and transition from summer through fall to winter in the freshwater pond illustration. As the weather gets cooler and the surface of the pond cools, the densest water, at 4 °C, sinks to the bottom (as the colored water does in the cup) displacing warmer water that is pushed toward the surface and moving nutrients from the depths toward the top. This process continues until the whole water column is at a uniform density and temperature, 4 °C. Continued cooling by wind and even colder temperature lowers the surface temperature toward the freezing point. The colder surface layers remain at the surface, because they are less dense than the lower, 4 °C strata. Finally, the surface freezes and the stratification shown for winter is relatively stable, because ice is a pretty good insulator. |
||||||||||
9.
|
The winds driving the winter through spring to summer and from summer through fall to winter bring with them the temperature of the surroundings, warming up as winter ends and cooling off as summer ends. They also disturb the surface of the water and cause mixing of the surface layers deeper into the pond, thus bringing the temperature signal from the surroundings to the lower layers and driving the nutrient turnover. The winds shown in the illustration differ mainly in temperature, warmer in the spring and cooler in the fall, thus warming the water in the spring and cooling it in the fall. A bench top demonstration of the way winds cause this mixing is available in this video. |
||||||||||
10.
|
The average atmospheric temperature increase means that seasonal winds are warmer than in the past. This means that the cooling from summer through fall to winter will not be as great and will generally come later. Similarly, the winds driving the transition from winter through spring to summer will be somewhat warmer and arrive a bit earlier. The result will be later arrival of winter ice and earlier loss of the ice. This effect is demonstrated by lakes for which long term records of ice-on and ice-off are available. |
||||||||||
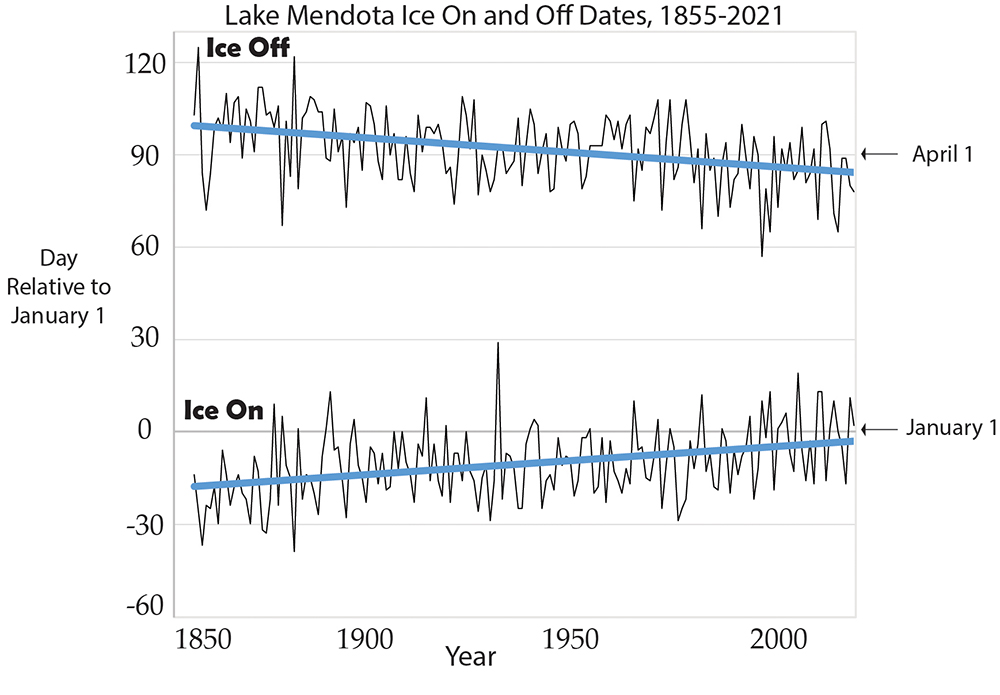
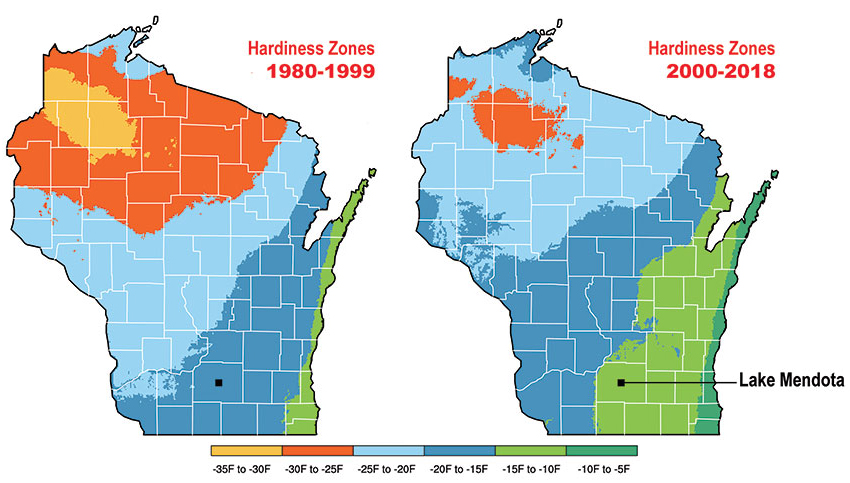
The University of Wisconsin-Madison campus borders Lake Mendota, a large Wisconsin lake, so it is not surprising that the lake has been extensively studied over many years. The lake freezes over in the winter and, beginning in the middle of the 19th century, a record has been kept of the date the lake is first completely frozen (ice-on date) and the date when the ice first begins to break up (ice-off date). Figure 9 is a plot of these dates from the winter of 1855-56 through 2020-2021. Over this 165-year period, the length of time the lake remains frozen each winter has decreased by about four weeks. The climate of Wisconsin becoming milder is also reflected in changes in its plant hardiness zones, Figure 10. Data for hardiness zone maps come from farmers and gardeners who keep track of winter temperatures. In a warming world, milder weather is moving toward the poles everywhere. |
|||||||||||
|
|||||||||||
|
|||||||||||
11.
|
If solid water were denser than liquid water, ice would sink to the bottom of lakes and seas as they began to freeze. This process would continue until the entire volume of water was frozen solid and unable to sustain living organisms. In the pond shown in Figure 4, fish and other organisms survive in the liquid (with adaptations evolved to live in the frigid water). It is unlikely that life, as we know it, could have evolved in a world without liquid water. The possibility of life having evolved, even to the single-cell stage, on Mars or the moons of Jupiter or Saturn, depends on there being (or having been) liquid water available. Some surface features of Mars appear to be the result of erosion by flowing water and there also seem to be the dry remnants of seas. The NASA rover Perseverance that landed on Mars in 2020 is equipped with tools and instrumentation to test for the presence of minerals that would be formed by reactions with water as well as for signs of life (past or present). There is evidence that liquid water exists below an ice crust on Saturn’s moon Enceladus. |
||||||||||
|
|||||||||||
To obtain a Word file of this Activity, please fill out this brief form to help us track what is happening to our Workbook. We also encourage you to get in touch if you have an activity or idea for an activity that might add to the Workbook. We want to make this an alive and active document. |
|||||||||||
| Back to Table of Contents | |||||||||||
 |